Figures & data
Table 1 Proteins identified by in-gel digestion and nanoLC-MS/MS of SDS-PAGE-isolated bands
Figure 1 Pictorial description of the whole process from nanoparticles fabrication to splitting: (a) anodization of silicon wafer to produce porous silicon film; (b) porous silicon film on silicon substrate; (c) nanoporous nanoparticles (NPNPs) fabricated by ultrasonication; (d) incubation of the nanoparticles with biological fluid; (e) centrifugation and wash; (f) supernatant; (g) pellet (physiological solution is added to dissolve it); (h) low-molecular-weight (LMW) harvesting and enrichment is demonstrated on a gel electrophoresis. The middle panel shows a scanning electron microscope image of nanoparticles.
Abbreviation: HMW, high molecular weight.
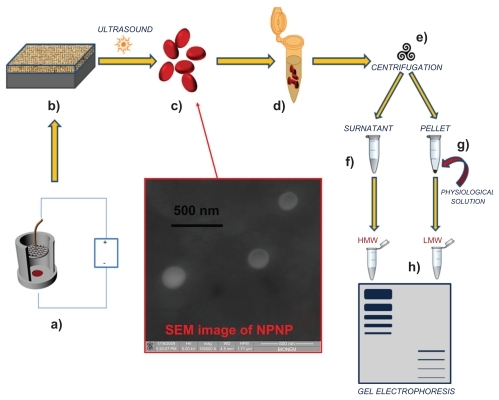
Figure 2 Nanoporous nanoparticles characterization. Scanning electron microscope images of nanoporous nanoparticles dried on a slide (panels A and B). The pores of the particles are too small to be shown, but the typical emission spectrum in red-orange band (panels C and D) indicates a pore size of about 2–3 nm (excitation wavelength 408 nm).
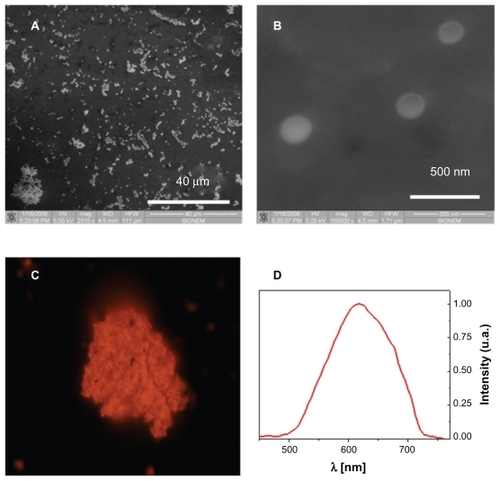
Figure 3 Optical and fluorescence images of the nanoporous nanoparticles (NPNPs) after incubation with 2 fluorescent polymers of different molecular weights (MWs): dextran-FITC 14 kDa (panels A and B), and dextran-FITC 6 kDa (panels C and D). The adsorption of the lighter polymer is clearly indicated by the green fluorescence emitted from the nanoparticles (panel D). In contrast, no green fluorescence can be observed being emitted from the heavier polymer (the blue fluorescence comes from salt residues), confirming the MW cut-off.
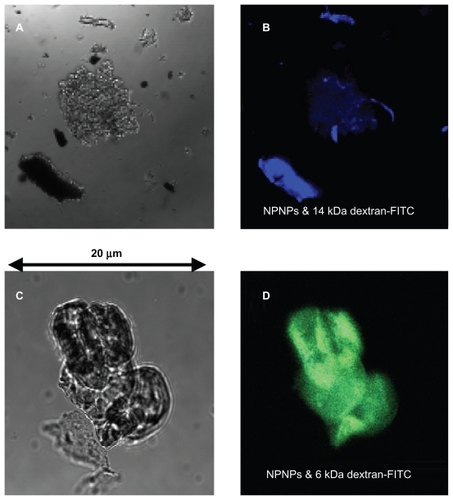
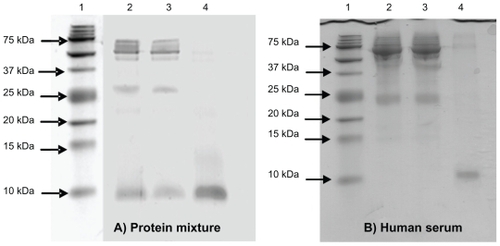
Figure 4 (A) The sodium dodecyl sulfate polyacrylamide gel electrophoresis (SDS-PAGE) analysis of protein mixture before and after incubation with nanoporous silicon particles. 100 mL of protein mixture (see text for details) was subjected to incubation with nanoparticles. Aliquots of the mixture before and after incubation were subjected to tristricine SDS-PAGE and stained with Coomassie Brilliant Blue. Lane 1 A: molecular weight markers; lane 2 A: protein mixture before incubation; lane 3 A: protein mixture following nanoparticle incubation (supernatant); lane 4 A, low-molecular-weight (LMW) protein fraction enriched (pellet). (B) SDS-PAGE analysis of human serum before and after incubation with nanoporous silicon particles. Serum was diluted to 1:2 with 100 mM sodium phosphate buffer, 9% (p/v) sodium chloride, pH 7.4, and incubated with nanoparticles. Aliquots of serum before and after incubation were subjected to tristricine SDS-PAGE and stained with Coomassie Brilliant Blue. Lane 1B, molecular weight markers; lane 2B, crude human serum; lane 3B, human serum following nanoparticle incubation (supernatant); lane 4B, LMW serum fraction enriched using (nondenaturing conditions) nanoporous silicon particles (pellet).