
Figures & data
Figure 1 Preparation scheme of co-delivery nanoparticles.
Abbreviations: DOX, doxorubicin; VCR, vincristine; TPGS, D-α-tocopheryl polyethylene glycol 1000 succinate; PLGA, poly(lactic-co-glycolic acid); NPs, nanoparticles; CS-ALG-DOX NPs, chitosan-alginate nanoparticles carrying doxorubicin; TPGS-PLGA-VCR NPs, vitamin E D-α-tocopheryl polyethylene glycol 1000 succinate-modified poly(lactic-co-glycolic acid) nanoparticles carrying vincristine; CS-ALG-NPs, chitosan-alginate nanoparticles; TPGS-PLGA NPs, vitamin E d-a-tocopheryl polyethylene glycol 1000 succinate-modified poly(lactic-co-glycolic acid) nanoparticles; CS-ALG-DOX@TPGS-PLGA-VCR NPs, CS-ALG-DOX NPs loaded at TPGS-PLGA-VCR NPs.
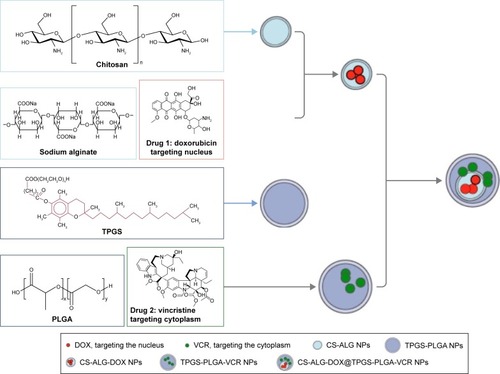
Figure 2 Physicochemical characterization of empty nanoparticles and drug-loaded nanoparticles. (A) TEM and SEM images of CS-ALG NPs and CS-ALG@TPGS-PLGA NPs. (B) TEM and SEM images of CS-ALG-DOX NPs and CS-ALG-DOX@TPGS-PLGA-VCR NPs. (C) The fluorescence images of CS-ALG-DOX@TPGS-PLGA-C6 NPs with CLSM.
Notes: Green fluorescence originating from C6 shows TPGS-PLGA-C6 NPs; red fluorescence coming from DOX represents CS-ALG-DOX NPs; and the overlapping fluorescence of yellow originating from red plus green indicates CS-ALG-DOX@TPGS-PLGA-C6 NPs. Scale bar, 1 μm.
Abbreviations: DOX, doxorubicin; VCR, vincristine; TPGS, D-α-tocopheryl polyethylene glycol 1000 succinate; PLGA, poly(lactic-co-glycolic acid); ALG, alginate; CS, chitosan; NPs, nanoparticles; TEM, transmission electron microscope; SEM, scanning electron microscope; CS-ALG-DOX NPs, chitosan-alginate nanoparticles carrying doxorubicin; TPGS-PLGA-VCR NPs, vitamin E D-α-tocopheryl polyethylene glycol 1000 succinate-modified poly(lactic-co-glycolic acid) nanoparticles carrying vincristine; C6, coumarin-6; CLSM, confocal laser scanning microscopy.
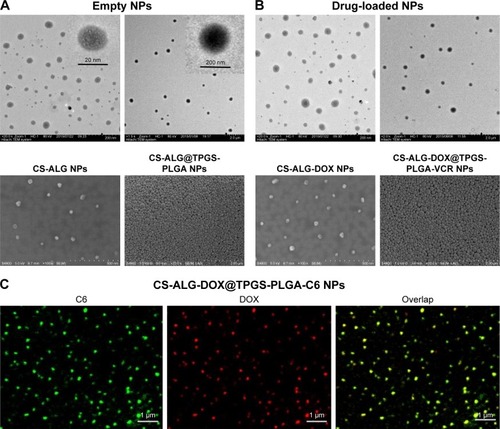
Figure 3 In vitro release characteristics of the nanoparticles with pH sensitivity. (A) TEM images of CS-ALG@TPGS-PLGA NPs incubated with PBS at pH 7.4 for 6 h. (B) TEM images of CS-ALG@TPGS-PLGA NPs incubated with PBS at pH 5.0 for 6 h. (C) The release curve of VCR from CS-ALG@TPGS-PLGA-VCR NPs in PBS (pH 7.4 and pH 5.8). (D) The release curve of DOX from CS-ALG-DOX NPs in PBS (pH 7.4, pH 5.8, and pH 5.0).
Notes: The data of (C) and (D) are presented as the mean values ± SD (n=3). Black arrows indicate that some smaller NPs released from the larger NPs.
Abbreviations: TEM, transmission electron microscope; CS-ALG-DOX NPs, chitosan-alginate nanoparticles carrying doxorubicin; TPGS-PLGA-VCR NPs, vitamin E D-α-tocopheryl polyethylene glycol 1000 succinate-modified poly(lactic-co-glycolic acid) nanoparticles carrying vincristine; PBS, phosphate-buffered saline; SD, standard deviation; VCR, vincristine; NPs, nanoparticles; DOX, doxorubicin.
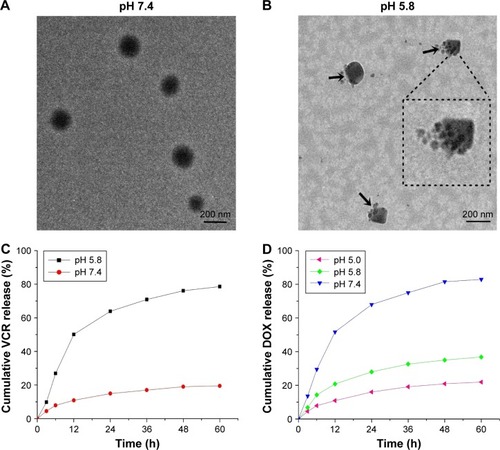
Figure 4 The evaluation of in vitro pharmacological effects of free drug VCR and drug-loaded nanoparticles TPGS-PLGA-VCR NPs incubated for 12 h. The effect on the microtubule in A549 cell (A) and A549/taxol cell (B) with tubulin-tracker red under CLSM. The effect on the microfilament in A549 cell (C) and A549/taxol cell (D) with actin-tracker green under CLMC. (E) Cell cycle of A549 cell and A549/taxol cell using a flow cytometer.
Notes: Red fluorescence indicates the microtubules labeled with tubulin-tracker, and blue fluorescence represents nuclear staining by Hoechst 33342. Green fluorescence indicates microfilament labeled with actin-tracker and blue fluorescence represents nuclear staining by Hoechst 33342. Scale bar, 10 μm.
Abbreviations: TPGS-PLGA-VCR NPs, vitamin E D-α-tocopheryl polyethylene glycol 1000 succinate-modified poly(lactic-co-glycolic acid) nanoparticles carrying vincristine; VCR, vincristine; NPs, nanoparticles; CLSM, confocal laser scanning microscopy.
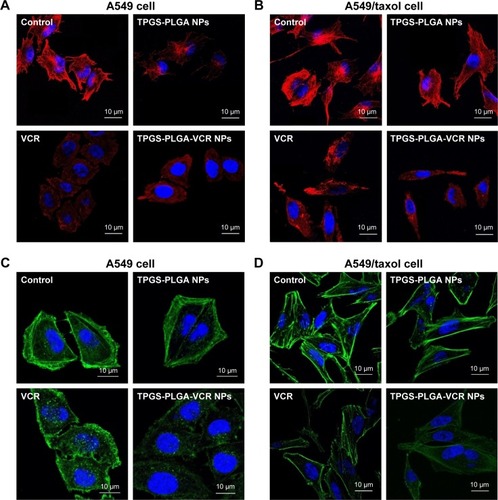
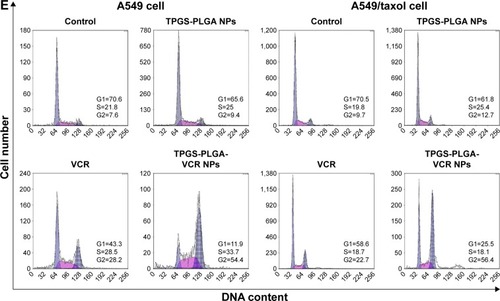
Figure 5 The intracellular migration fluorescence images of CS-ALG-DOX@TPGS-PLGA-C6 NPs.
Notes: Red fluorescence indicates inner smaller CS-ALG NPs labeled with free DOX, green fluorescence indicates outer larger TPGS-PLGA-C6 NPs, and blue fluorescence indicates the region of the nucleus stained with Hoechst 33342. Yellow fluorescence (red overlapping green) represents the co-localization of CS-ALG NPs and TPGS-PLGA NPs, and purple fluorescence (red overlapping blue) represents the co-localization of CS-ALG NPs and the nucleus. Scale bar, 10 μm.
Abbreviations: DOX, doxorubicin; C6, coumarin-6; CS-ALG NPs, chitosan-alginate nanoparticles carrying doxorubicin; TPGS-PLGA-C6 NPs, vitamin Ed-a-tocopheryl polyethylene glycol 1000 succinate-modified poly(lactic-co-glycolic acid) nanoparticles carrying C6; CS-ALG-DOX@TPGS-PLGA-C6 NPs, CS-ALG NPs located at TPGS-PLGA-C6 NPs.
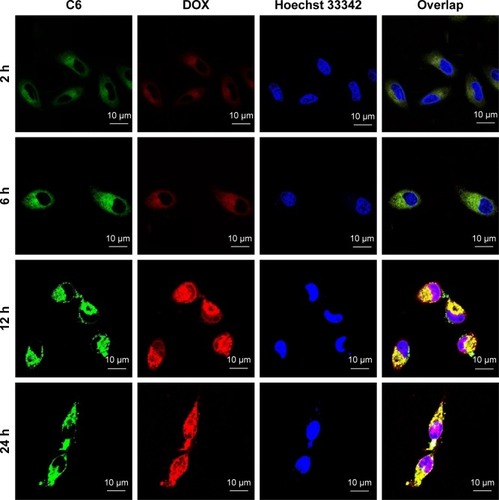
Figure 6 The fluorescence image of inner smaller CS-ALG-DOX NPs escaped from the endosome.
Notes: CS-ALG-DOX NPs are used to trace the intracellular localization of the nanoparticles to evaluate the correlation between the nanoparticles and lysosomes. Red fluorescence indicates CS-ALG-DOX NPs, green fluorescence from lyso-tracker green DND-26 indicates the lysosomes, and blue fluorescence represents the nuclear staining with Hoechst 33342. Scale bars, 10 μm.
Abbreviations: CS-ALG-DOX NPs, chitosan-alginate nanoparticles carrying doxorubicin; NPs, nanoparticles; DOX, doxorubicin.
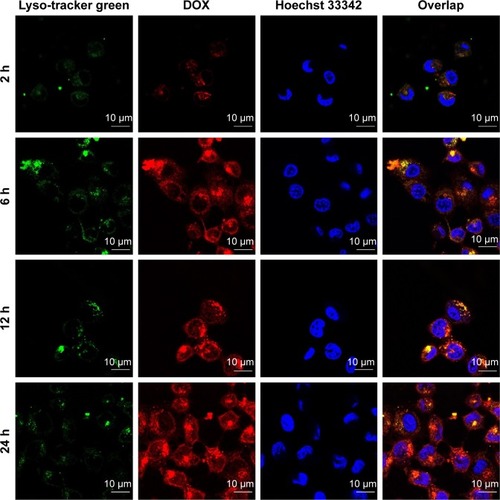
Figure 7 General state of tumor-bearing nude mice with A549 xenograft model. (A) Schematic plan of in vivo experiments. (B) The growth curve of mice during 19-day course of therapy. (C) Organic coefficient of mice.
Notes: Data are presented as mean ± SD (n=5). *P≤0.05; **P≤0.01, compared with control.
Abbreviations: CS-ALG-DOX NPs, chitosan-alginate nanoparticles carrying doxorubicin; TPGS-PLGA-VCR NPs, vitamin E D-α-tocopheryl polyethylene glycol 1000 succinate-modified poly(lactic-co-glycolic acid) nanoparticles carrying vincristine; SD, standard deviation; VCR, vincristine; NPs, nanoparticles; DOX, doxorubicin; CS-ALG-DOX@TPGS-PLGA-VCR NPs, CS-ALG-DOX NPs located at TPGS-PLGA-VCR NPs.
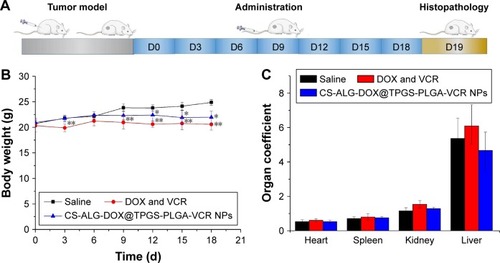
Figure 8 The comparison of in vivo antitumor efficiency between DOX and VCR and CS-ALG-DOX@TPGS-PLGA-VCR NPs. (A) The photographs of tumors tissue. (B) The weight of tumors tissue. (C) Pathological sections of the tumor tissues with H&E stain and TUNEL stain.
Notes: Data are presented as mean ± SD (n=5). *P<0.05. **P≤0.01, compared with control. ≤P≤0.05, compared between co-delivery nanoparticles with free DOX and VCR.
Abbreviations: CS-ALG-DOX NPs, chitosan-alginate nanoparticles carrying doxorubicin; TPGS-PLGA-VCR NPs, vitamin E D-α-tocopheryl polyethylene glycol 1000 succinate-modified poly(lactic-co-glycolic acid) nanoparticles carrying vincristine; SD, standard deviation; H&E, hematoxylin and eosin; TUNEL, transferase-mediated deoxyuridine triphosphate-biotin nick end labeling; VCR, vincristine; NPs, nanoparticles; DOX, doxorubicin; CS-ALG-DOX@TPGS-PLGA-VCR NPs, CS-ALG-DOX NPs located at TPGS-PLGA-VCR NPs.
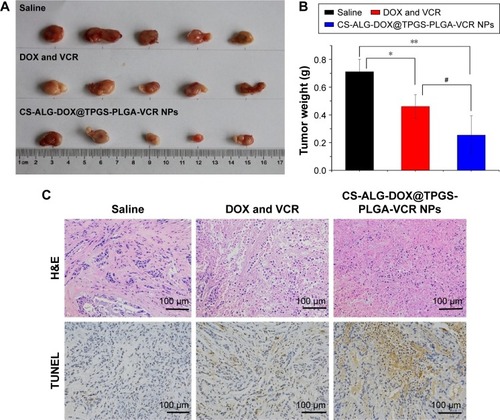
Figure 9 Schematic illustration of the co-delivery nanoparticles reversing MDR.
Abbreviations: MDR, multidrug resistance; P-gp, P-glycoprotein.
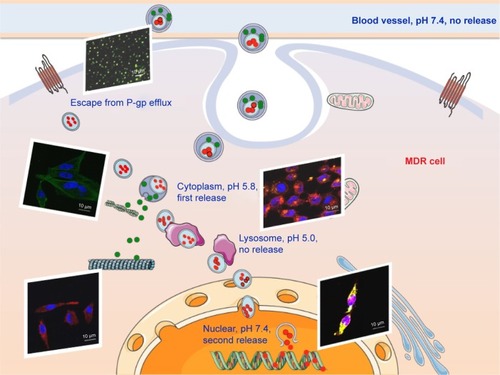
Figure S1 The size distribution of empty nanoparticles and drug-loaded nanoparticles are determined by DLS. (A) CS-ALG@TPGS-PLGA NPs and (B) CS-ALG-DOX@ TPGS-PLGA-VCR NPs.
Abbreviations: DLS, dynamic light scattering; CS-ALG NPs, chitosan-alginate nanoparticles; CS-ALG-DOX NPs, chitosan-alginate carrying doxorubicin nanoparticles; CS-ALG-DOX@TPGS-PLGA-VCR NPs, CS-ALG-DOX nanoparticles located at TPGS-PLGA-VCR NPs; TPGS-PLGA-VCR NPs, vitamin E D-α-tocopheryl polyethylene glycol 1000 succinate-modified poly(lactic-co-glycolic acid) nanoparticles carrying vincristine.
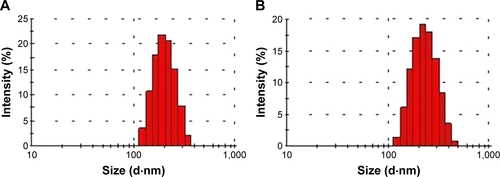
Figure S2 The chemical structure of the raw materials, empty nanoparticles, and drug-loaded nanoparticles are analyzed by FT-IR. (A) CS, ALG, CS-ALG NPs; (B) DOX, CS-ALG-DOX NPs; (C) TPGS, PLGA, TPGS-PLGA NPs; and (D) CS-ALG@TPGS-PLGA NPs, VCR, CS-ALG-DOX@TPGS-PLGA-VCR NPs.
Abbreviations: FT-IR, Fourier transform infrared spectroscopy; CS-ALG-DOX NPs, chitosan-alginate nanoparticles carrying doxorubicin; TPGS-PLGA-VCR NPs, vitamin E D-α-tocopheryl polyethylene glycol 1000 succinate-modified poly(lactic-co-glycolic acid) nanoparticles carrying vincristine; CS, chitosan; ALG, alginate; VCR, vincristine; NPs, nanoparticles; DOX, doxorubicin; TPGS, D-α-tocopheryl polyethylene glycol 1000 succinate; PLGA, poly(lactic-co-glycolic acid); CS-ALG-DOX@TPGS-PLGA-VCR NPs, CS-ALG-DOX nanoparticles located at TPGS-PLGA-VCR NPs.
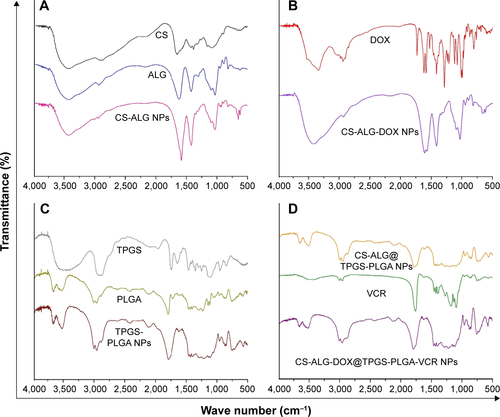
Figure S3 In vitro cell viability and apoptosis analysis of empty nanoparticles on A549 cell and A549/taxol cell. The viability of A549 cell (A) and A549/taxol cell (B) treated with CS-ALG NPs or CS-ALG@TPGS-PLGA NPs for 12 h and 24 h, respectively. (C) The apoptosis ratios of A549/taxol cell treated with CS-ALG@TPGS-PLGA NPs at different concentrations for 12 h by flow cytometer.
Notes: The quadrant of image: lower left is the count of healthy cells, lower right is the count of early apoptotic cells, upper right is the count of late apoptotic cells, and upper left is the count of necrotic cells.
Abbreviations: CS-ALG NPs, chitosan-alginate nanoparticles; TPGS-PLGA NPs, vitamin E d-α-tocopheryl polyethylene glycol 1000 succinate-modified poly(lactic-co-glycolic acid) nanoparticles; PI, Propidium Iodide; AV, Annexin V; CS-ALG@TPGS-PLGA-VCR NPs, CS-ALG nanoparticles located at TPGS-PLGA-VCR NPs.
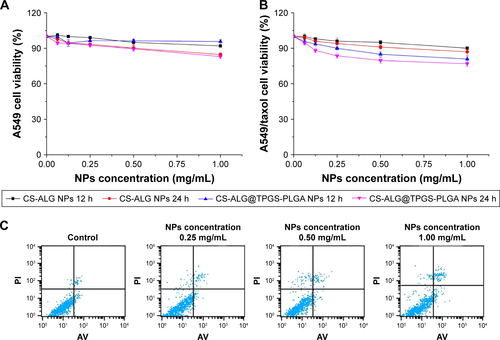
Figure S4 The compare of in vitro cytotoxic between free drugs (DOX, VCR, DOX and VCR) and drug-loaded nanoparticles (CS-ALG-DOX@TPGS-PLGA NPs, TPGS-PLGA-VCR NPs, or CS-ALG-DOX@TPGS-PLGA-VCR NPs) at various concentrations for 12 h and 24 h, respectively. (A) A549 cell and (B) A549/taxol cell.
Notes: Data are presented as mean values ± SD (n=3). *P<0.05 and **P<0.01.
Abbreviations: CS-ALG-DOX NPs, chitosan-alginate nanoparticles carrying doxorubicin; TPGS-PLGA-VCR NPs, vitamin E d-α-tocopheryl polyethylene glycol 1000 succinate-modified poly(lactic-co-glycolic acid) nanoparticles carrying vincristine; SD, standard deviation; DOX, doxorubicin; VCR, vincristine; NPs, nanoparticles; CS-ALG-DOX@TPGS-PLGA-VCR NPs, CS-ALG-DOX nanoparticles located at TPGS-PLGA-VCR NPs.
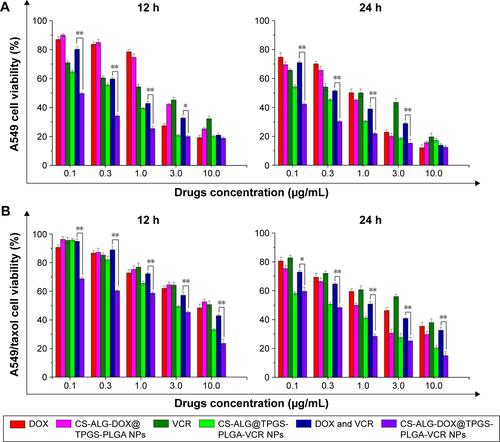
Figure S5 The uptake and intracellular migration of free DOX in A549 cell (A) and A549/taxol cell (B) at different time points observed by CLSM. Notes: Red fluorescence represents free DOX, and blue region represents nucleus. Scale bar, 10 μm.
Abbreviations: DOX, doxorubicin; CLSM, confocal laser scanning microscopy.
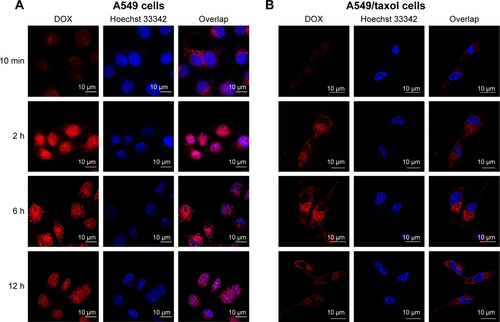
Figure S6 Tumor growth curve of the mice bearing A549 cells xenograft after intravenous injected with saline, DOX and VCR, CS-ALG-DOX@TPGA-PLGA-VCR. Notes: The data are presented as the mean values ± SD (n=5). *P<0.05 and **P<0.01 compared with control. #P<0.05, compared with DOX and VCR. Abbreviations: CS, chitosan; ALG, alginate; DOX, doxorubicin; TPGS, vitamin E d-α-tocopheryl polyethylene glycol 1000 succinate; PLGA, poly(lactic-co-glycolic acid); VCR, vincristine; SD, standard deviation; CS-ALG-DOX@TPGS-PLGA-VCR NPs, CS-ALG-DOX nanoparticles located at TPGS-PLGA-VCR NPs.
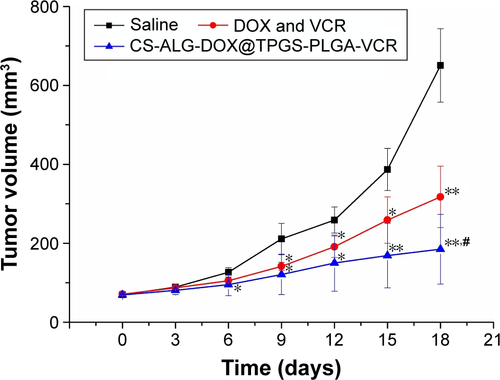
Figure S7 The comparison of in vivo toxicity efficiency on major organs between DOX and VCR and CS-ALG-DOX@TPGS-PLGA-VCR NPs.
Note: Pathological sections of the organs were stained with H&E stain method.
Abbreviations: CS, chitosan; ALG, alginate; DOX, doxorubicin; TPGS, vitamin E d-α-tocopheryl polyethylene glycol 1000 succinate; PLGA, poly(lactic-co-glycolic acid); VCR, vincristine; CS-ALG-DOX NPs, chitosan-alginate nanoparticles carrying doxorubicin; TPGS-PLGA-VCR NPs, vitamin E d-α-tocopheryl polyethylene glycol 1000 succinate-modified poly(lactic-co-glycolic acid) nanoparticles carrying vincristine; H&E, hematoxylin and eosin.
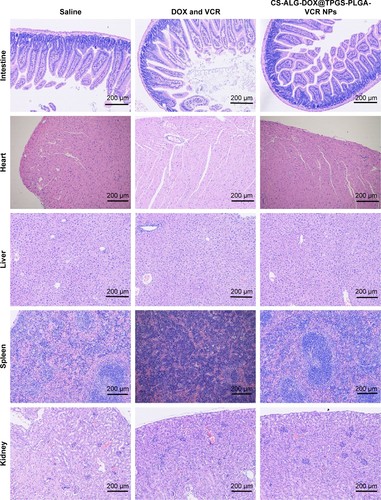
Figure S8 (A) Representative images of A549 xenograft tumors of mice after treatment with saline, DOX and VCR, and CS-ALG-DOX@TPGS-PLGA-VCR NPs at D19. (B) Ex vivo fluorescence imaging of tumors and major organs of the A549 tumor-bearing nude mice is performed at 24 h postinjection of free DiR and DiR-loaded NPs.
Abbreviations: CS-ALG-DOX NPs, chitosan-alginate nanoparticles carrying doxorubicin; TPGS-PLGA-VCR NPs, vitamin E d-α-tocopheryl polyethylene glycol 1000 succinate-modified poly(lactic-co-glycolic acid) nanoparticles carrying vincristine; DiR, 1′-dioctadecyl-3,3,3′,3′-tetramethylindotricarbocyanine iodide; CS, chitosan; ALG, alginate; DOX, doxorubicin; TPGS, vitamin E d-α-tocopheryl polyethylene glycol 1000 succinate; PLGA, poly(lactic-co-glycolic acid); VCR, vincristine; CS-ALG-DOX@ TPGS-PLGA-VCR NPs, CS-ALG-DOX nanoparticles located at TPGS-PLGA-VCR NPs.
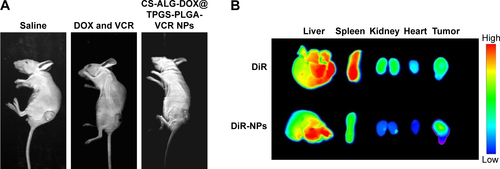
Table S1 EE and LE of nanoparticles
Table S2 IC50 and CI50 values of different formulations at 24 h