Figures & data
Figure 1 Design of the LDE particle, demonstrating its structure composed by nucleus made of cholesterol esters encapsulated by a monolayer of phospholipids and free cholesterol.
Abbreviation: LDE, cholesterol-rich nanoemulsion.
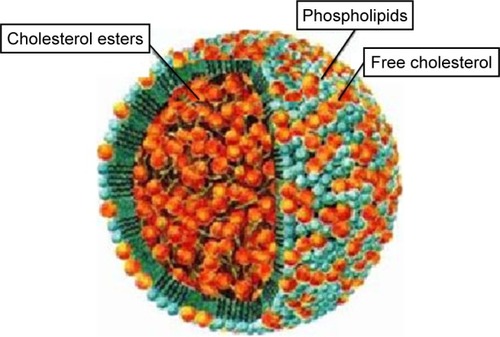
Figure 2 Tissue biodistribution of LDE in Cebus apella, as represented by tissue capture of intravenously injected [3H]-cholesterol ether after 24 hours. The figure shows the evaluation of the radioactivity measured in percentage, and the data are expressed in columns as mean and in bars as standard deviation.
Abbreviations: CPM, counts per minute; LDE, cholesterol-rich nanoemulsion.
![Figure 2 Tissue biodistribution of LDE in Cebus apella, as represented by tissue capture of intravenously injected [3H]-cholesterol ether after 24 hours. The figure shows the evaluation of the radioactivity measured in percentage, and the data are expressed in columns as mean and in bars as standard deviation.Abbreviations: CPM, counts per minute; LDE, cholesterol-rich nanoemulsion.](/cms/asset/aa6614c0-7334-426d-8580-1d84eb2f2eda/dijn_a_12193540_f0002_b.jpg)
Figure 3 Curve of kinetic decay in plasmatic [3H]-free cholesterol from LDE in Cebus apella. Points represent mean values and bars represent standard deviation.
Abbreviation: LDE, cholesterol-rich nanoemulsion.
![Figure 3 Curve of kinetic decay in plasmatic [3H]-free cholesterol from LDE in Cebus apella. Points represent mean values and bars represent standard deviation.Abbreviation: LDE, cholesterol-rich nanoemulsion.](/cms/asset/364bc4cf-16fd-44aa-bfb2-cd7a7214c2ce/dijn_a_12193540_f0003_b.jpg)
Table 1 Average values and SDs obtained in analysis of hematological parameters
Table 2 Average values and SDs obtained in analysis of biochemical parameters
Figure 4 Results of histopathological analysis of the stomach. (A) NC – normal mucosa showing mucoid cells, parietal and chief, and scattered vascular congestion. (B) LDE-PTX175 – normal mucosa showing mucoid cells, parietal and chief, and scattered vascular congestion. (C) LDE-PTX250 – normal mucosa showing mucoid cells, parietal and chief, presenting pervasion by some inflammatory mononuclear cells. (D) LDE-PTX250 – presence of intense vascular congestion in the submucosa. Magnification is 400×, and scale bar represents 50 μm.
Abbreviations: NC, negative control; LDE, cholesterol-rich nanoemulsion; PTX, paclitaxel.
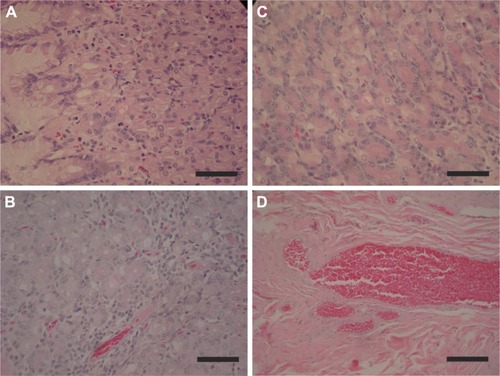
Figure 5 Results of histopathological analysis of the liver. (A) NC – cordons of preserved hepatocytes, seen in the portal space and centrilobular vein, and scattered microvesicular steatosis. (B) LDE-PTX175 – cordons of preserved hepatocytes, view of de portal space and centrilobular vein, and sinusoidal hemorrhage. (C) LDE-PTX250 – disorganization of hepatocyte cordons, hydropic and ballooning degeneration of hepatocytes, and inflammatory foci. Magnification is 400×, and scale bar represents 50 μm.
Abbreviations: NC, negative control; LDE, cholesterol-rich nanoemulsion; PTX, paclitaxel.
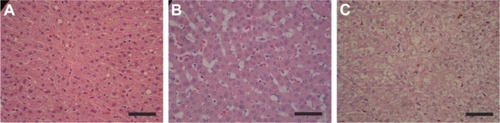
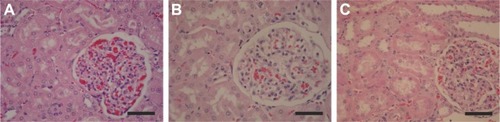
Figure 6 Results of histopathological analysis of the kidney. (A) NC – preserved glomerulus, unaltered proximal and distal tubules, and glomerular and interstitial hemorrhage. (B) LDE-PTX175 – preserved glomerulus, unaltered proximal and distal tubules, and glomerular and interstitial hemorrhage. (C) LDE-PTX250 – preserved glomerulus, proximal and distal tubes with cellular tumefaction, and glomerular and interstitial hemorrhage, several exhibiting cylinder hyaline. Magnification is 400×, and scale bar represents 50 μm.
Abbreviations: NC, negative control; LDE, cholesterol-rich nanoemulsion; PTX, paclitaxel.