Figures & data
Table 1 Composition of different thermosensitive bases. B represents the base number. All bases contain the same amount of progesterone (6 mg/mL)
Table 2 Physicochemical properties of progesterone nanoparticles
Figure 1 SEM images for a) the progesterone nanosuspension after lyophilization; b) the progesterone nanosuspension sample before lyophilization; c) the progesterone powder as received.
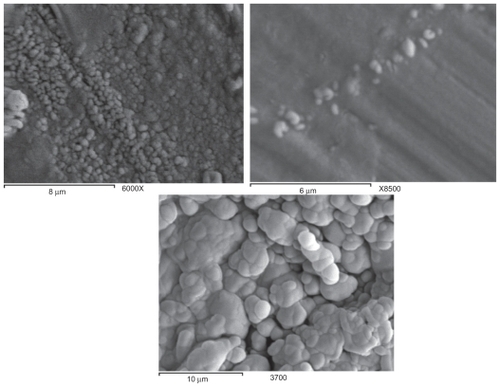
Figure 2 Differential scanning calorimetry thermograms for a) stearic acid; b) progesterone; c) progesterone nanosuspension.
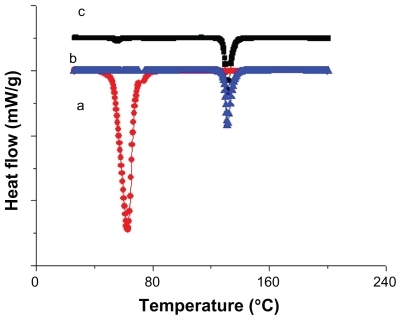
Table 3 DSC peak integrations for pure progesterone, pure stearic acid, and progesterone nanosuspension in lyophilized form
Figure 3 In vitro release of progesterone nanosuspension and progesterone powder. A) cumulative percentage drug release versus time; B) Higuchi plot of the cumulative percentage amount of drug released versus the square root of time.
Notes: progesterone powder suspended in phosphate-buffered saline (♦), progesterone nanosuspension stabilized with 5% (w/w) stearic acid (●), progesterone nanosuspension stabilized with 10% (w/w) stearic acid (▴), and progesterone nanosuspension stabilized with 20% (w/w) stearic acid (■). Each point represents the mean of three replicates. Error bars were omitted in some series for clarity. The in vitro release study was conducted at 25°C.
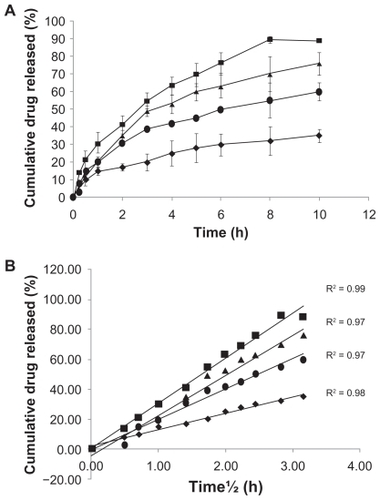
Table 4 Gelling temperature and viscosity of different F127 bases either in the presence or in the absence of progesterone (n = 4 ± SD)
Figure 4 The cumulative percentage weight of dissolved gel (matrix erosion or weight loss) of different F127 formulations at 37°C. A) B1 (♦) and B3 (■); B) B4 (♦), B5 (▴), and B6 (■); C) B7 (♦), B8 (▴), and B9 (■). B represents the base number.
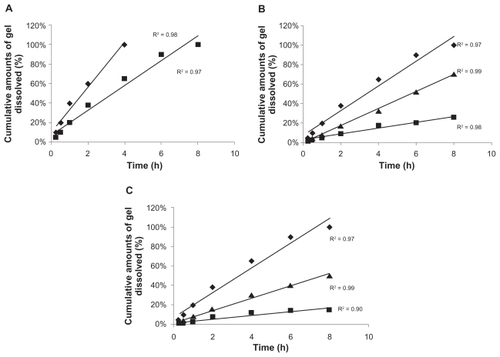
Figure 5 Cumulative drug release (%) versus time at 37°C for pluronic 25% (○), pluronic 25% and 1% HPMC (■), pluronic 30% and 1% HPMC (●), pluronic 25% and 1% MC (♦), and pluronic 30% and 1% MC (▴). Each point represents the mean of three replicates. Error bars were omitted for clarity.
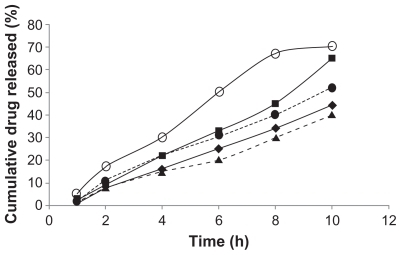
Figure 6 The correlation between the cumulative amount of dissolved gel (percentage weight of pluronic F127 dissolved alone or with hydrophilic additives) and the cumulative percentage weight of drug released during the first 8 h at 37°C. A) The concentration of pluronic is 25%; B) The concentration of pluronic is 30%. (♦) for MC, (■) for HPMC additives.
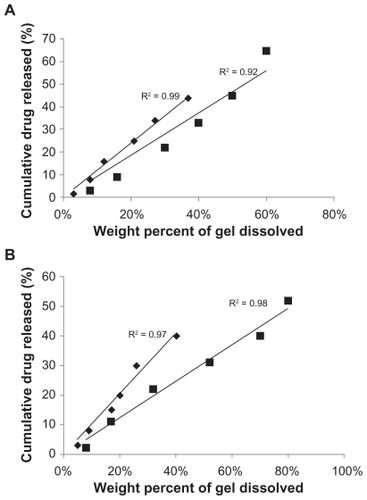
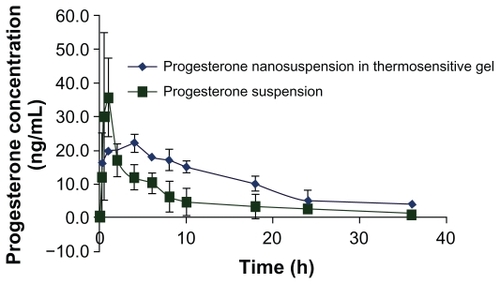
Figure 7 Pharmacokinetic profile of progesterone nanosuspension in F127 (25% w/v) with MC (1% w/v) (♦) and progesterone powder in PBS (■) in ovariectomized female rats.