Figures & data
Table 1 Properties of nanoconjugates evaluated in this study
Figure 1 TEM images showing silica NPs before (A) and after (B) the shell synthesis.
Abbreviations: NPs, nanoparticles; TEM, transmission electron microscopy.
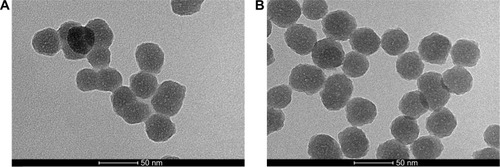
Figure 2 Assessment of nanoparticle–cell interaction by flow cytometry.
Note: Panels (A–D) represent the distribution of cell fluorescence intensity, normalized over untreated cells (control), in MDA-MB-468 and SK-BR-3 cell lines after exposure to (A) SiNP, (B) SiNP-TZ, (C) SiNP-NTA and (D) SiNP-NTA-TZ at 20 min, 1 h, 4 h and 24 h at a concentration of 50 mg/mL (Student’s t-test; *P<0.05 vs MDA-MB-468).
Abbreviations: NP, nanoparticle; TZ, trastuzumab; NTA, nitrilotriacetic acid.
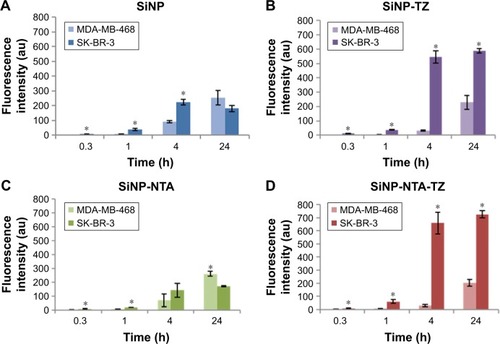
Figure 3 Specificity binding by fluorescence microscopy.
Notes: SK-BR-3 and MDA-MB-468 cells were grown on coverslips for 24 h and then exposed for 20 min, 1, 4 and 24 h to 50 µg/mL of FITC-labeled (green) SiNPs functionalized with (SiNP-NTA-TZ) or without (SiNP-NTA) Hc-TZ. Nuclei were stained with Hoechst (blue).
Abbreviations: FITC, fluorescein isothiocyanate; NP, nanoparticle; TZ, trastuzumab; NTA, nitrilotriacetic acid.
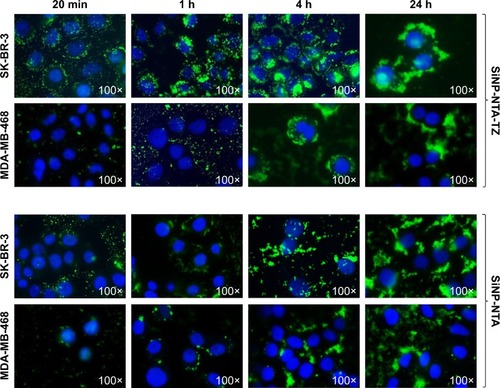
Figure 4 SiNPs toxicity was investigated both by (A) MTT and (B) cell viability tests.
Notes: SK-BR-3, MDA-MB-468 cells were incubated with SiNPs (100 µg/mL) for 1, 4, 24 and 48 h. Survival rate threshold of 60%.
Abbreviations: NP, nanoparticle; TZ, trastuzumab; NTA, nitrilotriacetic acid.
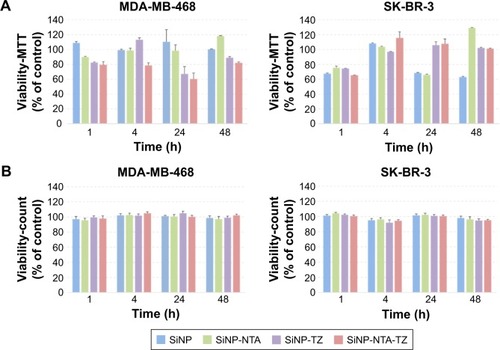
Figure 5 In vitro uptake of 99mTc-radiolabeled (A) SiNP-NTA and (B) SiNP-NTA-TZ NPs.
Notes: SK-BR-3 and MDA-MB-468 cells were incubated with SiNPs (1 µCi/mL) for 1, 4 and 24 h. Cell uptake was expressed as % of total radioactivity administered (Student’s t-test; *P<0.05 vs MDA-MB-468).
Abbreviations: NP, nanoparticle; TZ, trastuzumab; NTA, nitrilotriacetic acid.
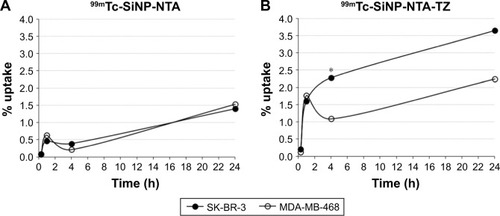
Figure 6 Ex vivo biodistribution of 99mTc-labeled SiNP-NTA and SiNP-NTA-TZ nanoparticles in HER+ breast cancer model.
Notes: SK-BR-3 tumor bearing mice were sacrificed at 4, 6 h (n=3) and 24 h (n=4) postinjection. Samples were dissected and analyzed by γ-counter to obtain tumor-to-muscle ratio (on the right) of %ID/g (on the left) values. Statistical differences between SiNP-NTA and SiNP-NTA-TZ were evaluated by Student’s t-test; *P<0.05.
Abbreviations: NP, nanoparticle; TZ, trastuzumab; NTA, nitrilotriacetic acid; TUM/MUS, tumour/muscle.
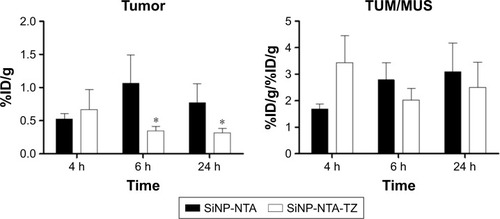
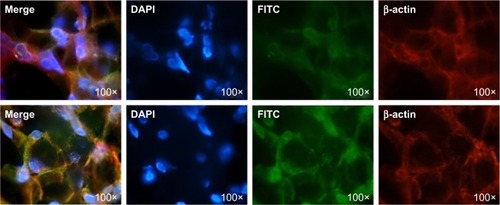
Figure 7 Ex vivo immunofluorescence of SK-BR-3 tumor cryosections collected at 4 h postinjection of SiNP-NTA (top) and SiNP-NTA-TZ (bottom).
Note: Merge images represent the colocalization of SiNPs (green), β-actin (red) and reporting nuclei (blue).
Abbreviations: DAPI, 4′,6-diamidino-2-phenylindole; FITC, fluorescein isothiocyanate; NP, nanoparticle; TZ, trastuzumab.
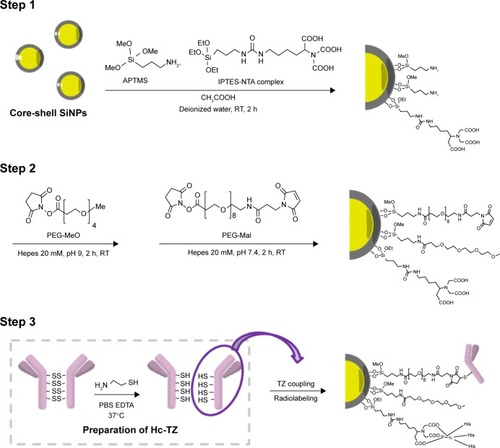
Scheme 1 Schematic representation of the synthetic steps for the preparation of SiNP-NTA-TZ.
Abbreviations: TZ, trastuzumab; PBS, phosphate saline buffer; RT, room temperature.