Figures & data
Figure 1 Fourier transform infrared spectroscopy (FTIR) spectra of A) cholesterol (CHL); B) soya-L-α-lecithin (SPC); C) doxorubicin (DOX); D) phosphatidylethanolamine (PE); E) mixture of SPC, CHL, and DOX; F) mixture of SPC, CHL, DOX, and PE; and G) lyophilized formulation (DOX-PEL).
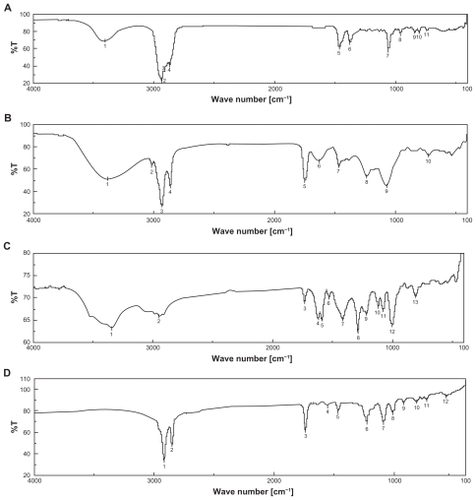
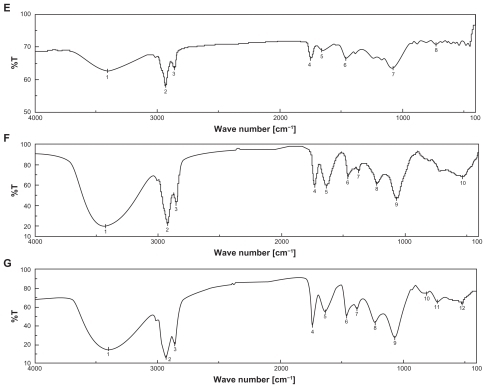
Figure 2 Differential scanning calorimetry (DSC) curve of A) cholesterol (CH L); B) soya-L-α-lecithin (SPC); C) phosphatidylethanolamine (PE); D) doxorubicin (DOX); and E) mixture of CHL, SPC, PE, and DOX.
Table 1 % yield, % loading and loading efficiency
Figure 3 Field emission scanning electron microscopy (FESEM) of A) doxorubicin-loaded liposomes (DOX-L); and B) doxorubicin-loaded PE liposomes (DOX-PEL).
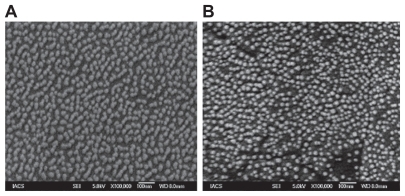
Figure 4 Energy dispersive X-ray (EDX) of A) doxorubicin-loaded liposomes (DOX-L); and B) doxorubicin-loaded PE liposomes (DOX-PEL).
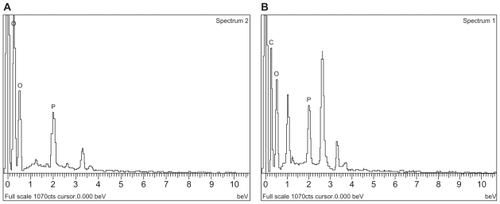
Table 2 Weight % and atomic % of elements in various liposomes
Figure 5 Particle size distribution of A) doxorubicin-loaded liposomes (DOX-L); and B) doxorubicin-loaded PE liposomes (DOX-PEL).
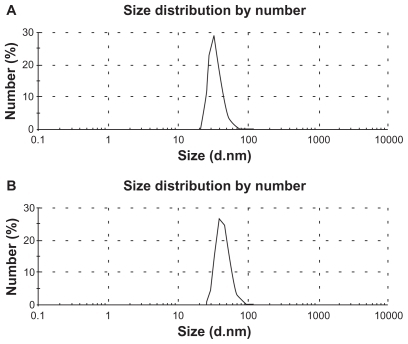
Table 3 Size distribution, PDI, and zeta potential of various liposomes
Figure 6 Release of doxorubicin from doxorubicin-loaded liposomes (DOX-L) and doxorubicin-loaded PE liposomes (DOX-PEL).
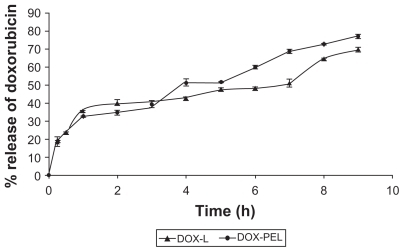
Table 4 In vitro release kinetics with R2 values for different formulations
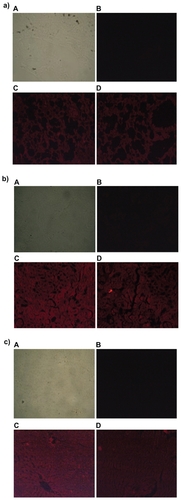
Figure 7 Fluorescence microscopic photographs of a) liver; b) kidneys; and c) lungs of rats treated with fluorescein isothiocyanate-phosphatidylethanolamine-doxorubicin (FITC-PE-DOX) liposomes (A = negative control; B = positive control; C = one hour after treatment; D = three hours after treatment).
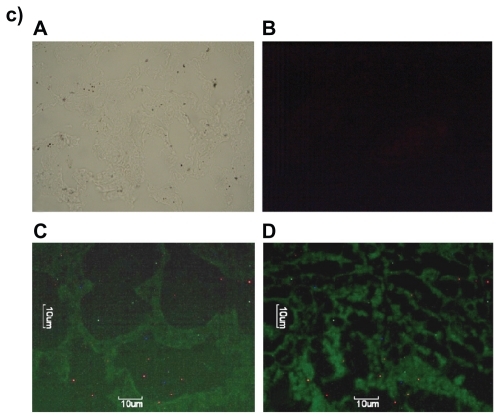
Figure 8 Fluorescence microscopic photographs of liver a), kidneys b) and lungs c); of rats treated with phosphatidylethanolamine-doxorubicin (PE-DOX) liposomes (A = negative control; B = positive control; C = one hour after treatment; D = three hours after treatment).
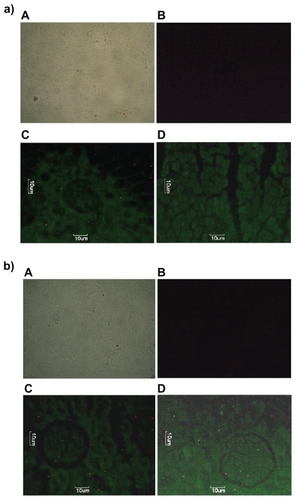
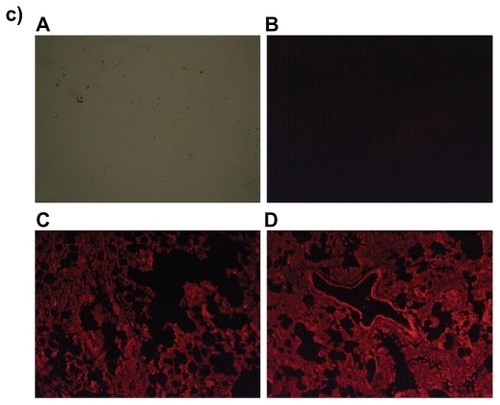
Figure 9 Fluorescence microscopic photographs of liver a), kidneys b) and lungs c); of rats treated with free DOX (A = negative control; B = positive control; C = one hour after treatment; D = three hours after treatment).