Figures & data
Figure 1 Schematic diagram of the electron beam evaporation process used in this study to create nanometer surface features on PE and Ti.
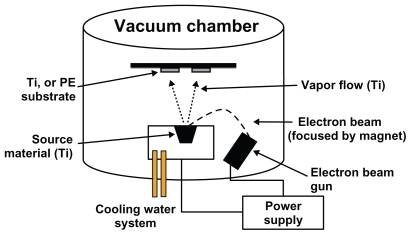
Figure 2 Scanning electron microscopy images of (a) conventional Ti, (b) nanorough Ti, (c) conventional PE, and (d) nanorough PE. Scale bars in (a) and (b) are 200 nm while in (c) and (d) are 1 μm.
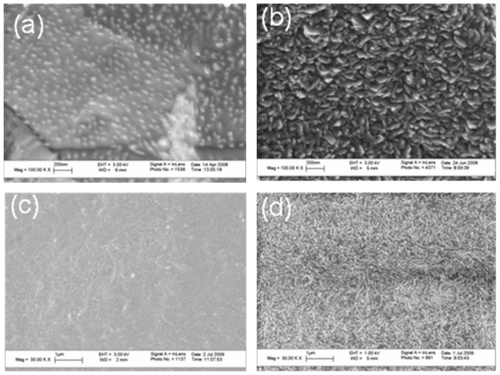
Figure 3 Greater surface energy for the nanorough Ti and nanorough PE compared to conventional Ti and conventional PE, respectively. Data are mean ± SEM; n = 4. *P < 0.01 compared to conventional Ti; **P < 0.01 compared to conventional PE.
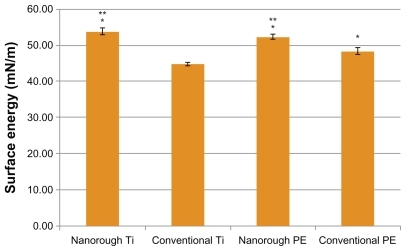
Table 1 Nanorough Ti and nanorough PE are less hydrophobic than their conventional counterparts
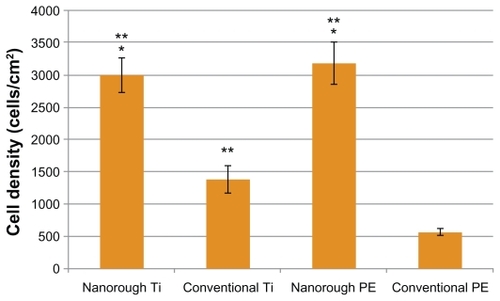
Figure 4 Greater osteoblast adhesion on nanorough Ti and nanorough PE as compared to their conventional counterparts. Data are mean ± SEM; n = 3. *P < 0.05 compared to conventional Ti; **P < 0.01 compared to nanorough Ti; P < 0.01 compared to conventional PE; #P < 0.01 compared to conventional Ti. Culture time = 4 hrs.
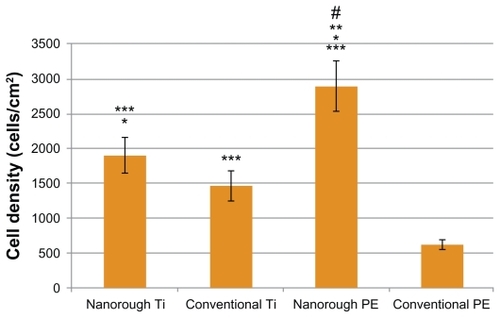
Figure 5 Greater endothelial cell adhesion on nanorough Ti and nanorough PE as compared to their conventional counterparts. Data are mean ± SEM; n = 3. *P < 0.01 compared to conventional Ti; **P < 0.01 compared to conventional PE. Culture time = 4 hrs.