Figures & data
Table 1 Properties of BMNPs in different organisms
Table 2 Magnetic iron minerals found in BMNPs
Figure 1 (A) TEM of magnetotactic bacterium (Magnetospirillum strain AMB1); (B) BMNP chain in a magnetotactic bacterium; (C) zoomed BMNP chain, showing several hexagonal grains (TEM courtesy of B Leszczyński); (D) schematic representation of BMNPs in a magnetosome vesicle. BMNPs of typical shapes observed in magnetotactic bacteria, each surrounded by lipid bilayers.
Abbreviations: TEM, transmission electron microscopy; BMNP, biogenic magnetic nanoparticle.
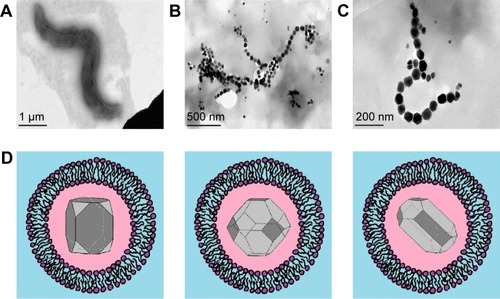
Figure 2 Taxa in which BMNPs have been observed experimentally.
Notes: Red boxes, BMNPs found in representatives of the given taxa; black rectangle, reported presence of biogenic magnetite in an unclear form (either phytoferritin or botanic BMNPs).
Abbreviation: BMNPs, biogenic magnetic nanoparticles.
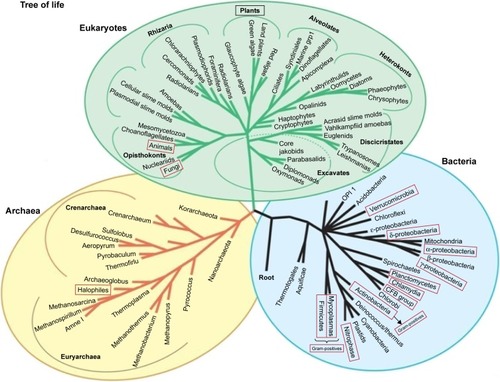
Figure 3 Ehrlich carcinoma cell.
Notes: AFM (left), MFM (right). Data from Chekchun et al.Citation21 MFM shows BMNPs in the form of dark spots arranged in chains (arrow).
Abbreviations: AFM, atomic force microscopy; MFM, magnetic force microscopy; BMNPs, biogenic magnetic nanoparticles.
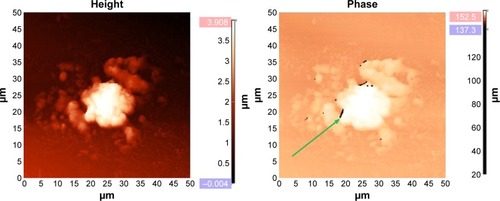
Figure 4 Fragment of an atherosclerotic plaque of mixed composition.
Notes: AFM (left), MFM (right). MFM shows BMNPs in the form of dark spots arranged in chains (arrow). There were no bacteria-like magnetosome BMNPs, but alignment of the BMNPs is visible along the plaque surface. Samples of atherosclerotic vessels were extracted from iliac artery during shunting surgery.
Abbreviations: AFM, atomic force microscopy; MFM, magnetic force microscopy; BMNPs, biogenic magnetic nanoparticles.
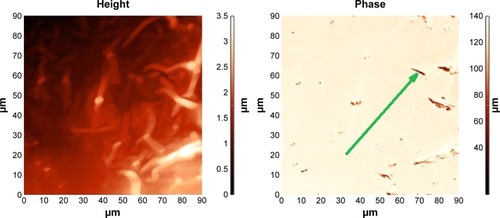
Table 3 Functional classes of proteins encoded by genes in the magnetosome islandCitation26,Citation30,Citation107,Citation109–Citation113
Figure 5 Schematic representation of BMNP biomineralization in magnetotactic bacteria.
Note: Black hexagonal symbols represent magnetic crystal growth inside magnetosome vesicles.
Abbreviation: BMNP, biogenic magnetic nanoparticle.
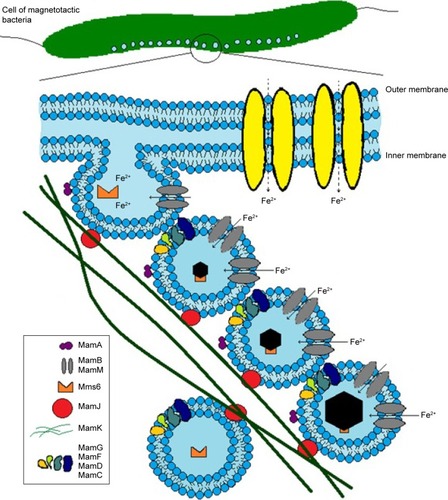
Table 4 Statistically significant alignment of MTB proteins with human proteins based on BLAST standard parametersCitation23
Table 5 Comparative table of functions of MTB proteins and their human homologuesCitation23,Citation116
Figure 6 Predicted biomineralization of intracellular BMNPs in eukaryotes, nonmagnetotactic prokaryotes, and archaea.
Note: Black shapes represent the magnetic crystals inside some organic material.
Abbreviation: BMNPs, biogenic magnetic nanoparticles.
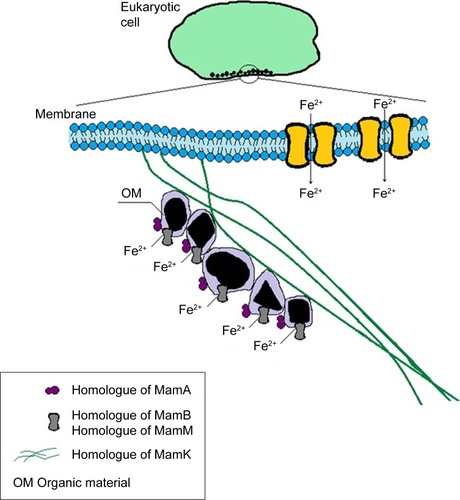
Figure 7 Saccharomyces cerevisiae yeast cells with magnetic nanoparticles.
Note: AFM (left) and MFM image (right), showing chains (arrow) of artificial magnetic nanoparticles formed at the biomembranes of the cells, due to magnetic dipole–dipole interaction among the magnetic nanoparticles.
Abbreviations: AFM, atomic force microscopy; MFM, magnetic force microscopy.
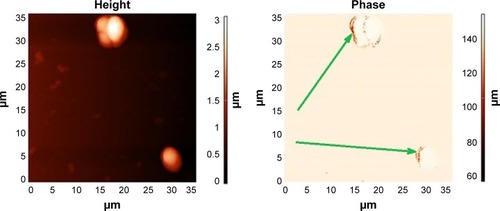
Table 6 Properties of proteins of the ferritin family
Figure 8 Schematic representation of ferritin molecule with twofold-, threefold-, and fourfold-symmetry axes.
Notes: Dps, PDB – 4DYU (top left); structure of human ferritin L-chain, PDB – 2FG8 (top center); structure of human ferritin L-chain, PDB – 2FFX (top right) (NCBI). The protein-shell diameter is 12 nm, and the core diameter 7–8 nm (right).
Abbreviations: PDB, Protein Data Bank; NCBI, National Center for Biotechnology Information.
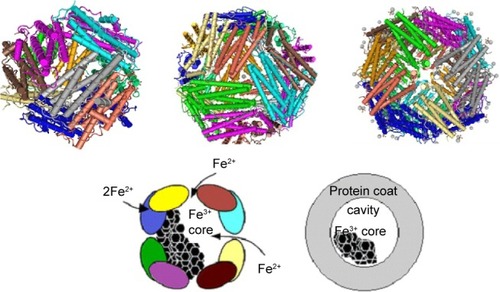
Figure 9 (A) Ferritin TEM (HSF), the white stripes inside the black box indicate the scale bar 100 nm; (B) particle-size distribution based on TEM.
Abbreviations: TEM, transmission electron microscopy; HSF, horse-spleen ferritin; SD, standard deviation.
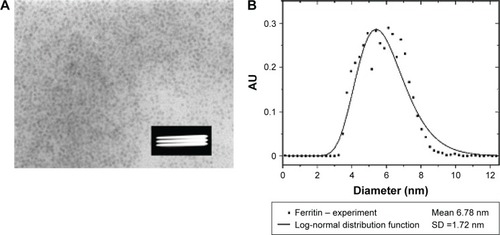
Table 7 Methods for study of magnetic properties of biogenic and synthetic ferritin and BMNPs
Figure 10 Schematic representation of synthetic pathway.
Note: Using apoferritin in vitro as a bioreactor for producing monodisperse metal (eg, Ag or Au), semiconductor (eg, CdS), or metal oxide (eg, Fe3O4) particles for applications in electronics or biomedicine.
Abbreviation: Fh, ferrihydrite.

Figure 11 Schematic representation of discrimination.
Notes: Based on differences in magnetic linear birefringence and MORD spectra between ferrite (magnetically strong) materials, such as magnetite/maghemite, and antiferromagnetic (magnetically weak) materials, such as ferrihydrite or akaganeite. For details of magnetically strong MORD data, see and Koralewski et al.Citation159 Magnetically weak MORD data were obtained for akaganeite-type materials, the same as were studied in Koralewski et al.Citation160
Abbreviations: MORD, magnetic optical rotatory dispersion; CCM, Cotton-Mouton constant; V, Verdet constant; D, particle diameter.
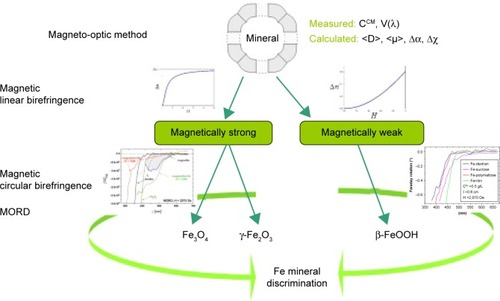
Figure 12 Reduced linear magnetic birefringence.
Notes: HSF, synthetic magnetoferritin (loading factor 1,250), magnetite, and a mixture of HSF and magnetite (Fe weight proportion 23:1) versus the square of the applied magnetic field – HCitation2. Dashed line indicates the low-field region in which the Cotton–Mouton (CCM) constant was determined (ie, Δn=CCMλHCitation2, where λ is light wavelength and H magnetic field intensity); solid line represents the best fit for the Langevin function. Reprinted from J Magn Magn Mater. Vol 323. Koralewski M, Pochylski M, Mitroova Z, Timko M, Kopcansky P, Melnıkova L. Magnetic birefringence of natural and synthetic ferritin. Pages 2413–2417. Copyright 2011, with permission from Elsevier.Citation139
Abbreviation: HSF, horse-spleen ferritin.
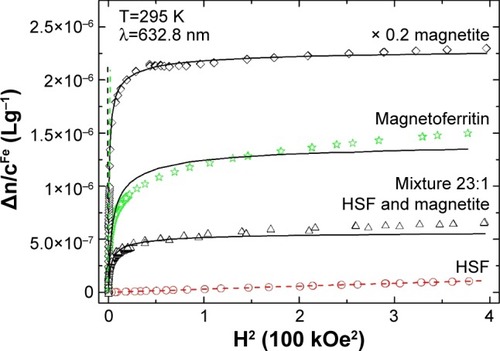
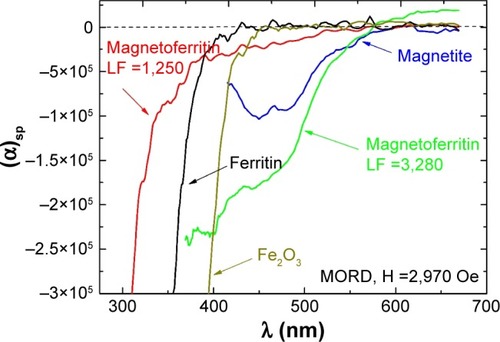
Figure 13 Wavelength dependence.
Notes: Faraday rotation (MORD) for HSF, synthetic magnetoferritin with different loading factors (loading factor 1,250 and 3,280), Fe2O3, and magnetite suspensions. Reprinted from Koralewski M, Kłos JW, Baranowski M, et al. The Faraday effect of natural and artificial ferritins. Nanotechnology. 2012;23:355704.Citation159 Copyright 2012. IOP Publishing Ltd.
Abbreviations: MORD, magnetic optical rotatory dispersion; HSF, horse-spleen ferritin; LF, loading factor.