
Figures & data
Figure 1 Particle size and PDI in culture media as a function of time: Z1/CMCS1 NPs (A), Z1/CMCS1-TA/Cu 2+1 NPs (B) and Z1/CMCS1-TA/Ca2+ NPs (C).
Notes: Control referred to the freshly prepared NPs without 10-fold diluting in culture media. Data displayed as mean ± SD (n=3). The Z1/CMCS1 NPs were prepared at a zein:CMCS ratio of 1:1 w/w with the final metal ion concentration of 0.24 mM (Cu12+or Ca2+).
Abbreviations: CMCS, carboxymethyl chitosan; NPs, nanoparticles; PDI, polydispersity index; TA, tannic acid; SD, standard deviation; Z1, zein1.
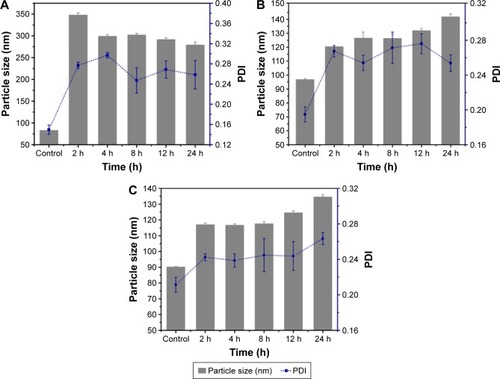
Figure 2 TEM image and size distribution of Z1/CMCS1 NPs (A) and (B), Z1/CMCS1-TA/Cu12+ NPs (C) and (D) and Z1/CMCS1-TA/Ca2+ NPs (E) and (F). TEM image of Z1/CMCS1-TA/Cu22+ NPs (G) and Z1/CMCS -TA/Cu32+ NPs (H). Digital photographs of the NPs are shown in I. 1 to 5 in I refer to Z1/CMCS1 NPs, Z1/CMCS1-TA/Cu12+ NPs, Z1/CMCS1-TA/Cu22+ NPs, Z1/CMCS1-TA/Cu32+ NPs and Z1/CMCS1-TA/Ca2+ NPs, respectively. The Z1/CMCS1 NPs were prepared at a zein:CMCS ratio of 1:1 w/w with the final metal ion concentration of 0.24 mM (Cu12+ or Ca2+), 0.48 mM (Cu22+) and 0.72 mM (Cu32+).
Abbreviations: CMCS, carboxymethyl chitosan; NPs, nanoparticles; TA, tannic acid; TEM, transmission electron microscope; SD, standard deviation; Z1, zein1.
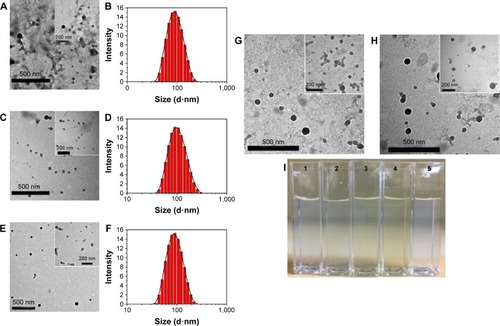
Figure 3 TEM image and size distribution of DOX-loaded Z1/CMCS1-TA/Cu12+ NPs (A–C) and Z1/CMCS1-TA/Ca2+ (D–F). The Z1/CMCS1 NPs were prepared at zein:CMCS ratio of 1:1 w/w with the final metal ion concentration of 0.24 mM (Cu12+ or Ca2+).
Abbreviations: CMCS, carboxymethyl chitosan; DOX, doxorubicin hydrochloride; NPs, nanoparticles; TA, tannic acid; TEM, transmission electron microscope; Z1, zein1.
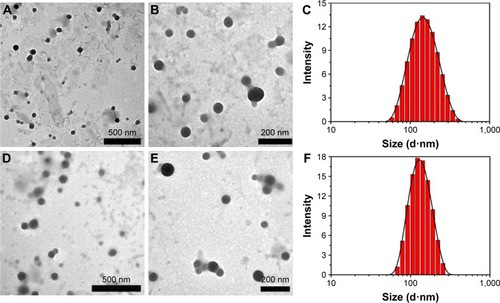
Figure 4 In vitro release profiles of DOX-loaded Z1/CMCS1 NPs (A), Z2/CMCS1-TA/Cu12+ NPs (B), Z2/CMCS1-TA/Cu22+ NPs (C), Z2/CMCS1-TA/Cu32+ NPs (D), Z1/CMCS1-TA/Cu12+ NPs (E), Z1/CMCS1-TA/Cu22+ NPs (F) and Z1/CMCS1-TA/Cu32+ NPs (G) in 0.01 M buffer under different pH conditions.
Notes: The Z2/CMCS1-TA/metal NPs were prepared at a zein:CMCS ratio of 2:1 w/w with the final metal ion concentration of 0.24 mM (Cu12+ or Ca2+), 0.48 mM (Cu22+) and 0.72 mM (Cu32+). The Z1/CMCS1-TA/metal NPs were prepared at a zein:CMCS ratio of 1:1 w/w with the final metal ion concentration of 0.24 mM (Cu12+ or Ca2+), 0.48 mM (Cu22+) and 0.72 mM (Cu32+).
Abbreviations: CMCS, carboxymethyl chitosan; DOX, doxorubicin hydrochloride; NPs, nanoparticles; TA, tannic acid; Z1, zein1; Z2, zein2.
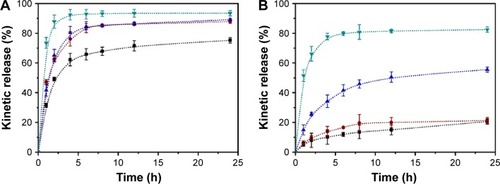
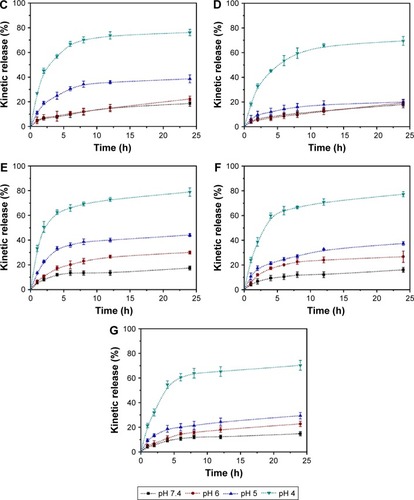
Figure 5 In vitro release profiles of DOX-loaded Z1/CMCS2-TA/Cu12+ NPs (A), Z2/CMCS1-TA/Ca2+ NPs (B), Z1/CMCS1-TA/Ca2+ (C) and Z1/CMCS2-TA/Ca2+ (D) in 0.01 M buffer under different pH conditions.
Abbreviations: CMCS, carboxymethyl chitosan; DOX, doxorubicin hydrochloride; NPs, nanoparticles; TA, tannic acid; Z1, zein1; Z2, zein2.
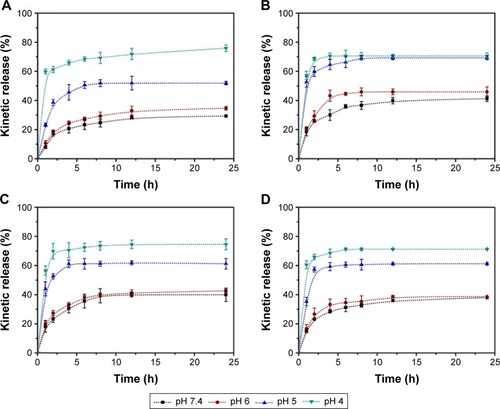
Figure 6 In vitro cytotoxicity of the blank NPs (A) and DOX-loaded NPs (B) against HepG2 cells incubated for 24 h.
Notes: In all panels, the indicated concentrations are DOX doses. It should be noted that for evaluating DOX-loaded NPs, equal concentrations of blank NPs were employed to eliminate the effect of vehicles in MTT assay. Data displayed as mean ± SD (n=6). **P<0.01 versus DOX-NPs group. The morphology of the cells after incubating for 24 h with NPs (D), NPs-TA/Cu12+ (E) and NPs-TA/Ca2+ (F) or DOX-NPs (G), DOX-NPs-TA/Cu12+ (H) and DOX-NPs-TA/Ca2+ (I) was evaluated by using optical microscopy with a 10× objective. (C) was the control. The scale bars represent 100 μm.
Abbreviations: DOX, doxorubicin hydrochloride; MTT, methylthiazolyldiphenyltetrazolium bromide; NPs, nanoparticles; TA, tannic acid; SD, standard deviation.
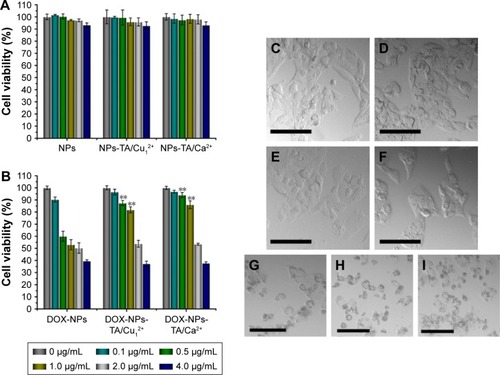
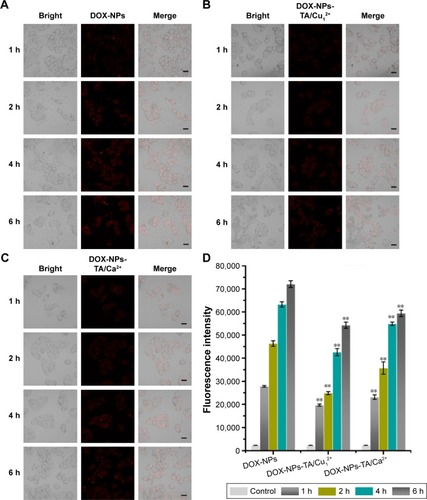
Figure 7 The qualitative (A–C) and quantitative (D) study of cellular uptake.
Notes: CLSM images of intracellular uptake of DOX-NPs (A), DOX-NPs-TA/Cu12+ NPs (B) and DOX-NPs-TA/Ca2+ NPs (C) by HepG2 cells. The scale bars represent 20 μm. Flow cytometry results of HepG2 cells as a function of time treated with DOX-loaded NPs (D). Data displayed as mean ± SD (n=3). **P<0.01 versus the DOX-NPs group.
Abbreviations: CLSM, confocal laser scanning microscopy; DOX, doxorubicin hydrochloride; NPs, nanoparticles; TA, tannic acid; SD, standard deviation.
Scheme 1 Illustration of the synthesis and structures of DOX-loaded zein/CMCS NPs coated by metal–TA films and the proposed model for pH-dependent drug release in tumor cells.
Abbreviations: CMCS, carboxymethyl chitosan; DOX, doxorubicin hydrochloride; NPs, nanoparticles; TA, tannic acid.
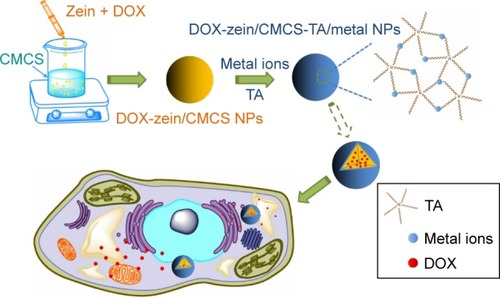
Figure S1 Fourier transform infrared spectroscopy (FTIR) spectra of different samples.
Notes: NPs-Cu12+, NPs-Cu22+, NPs-Cu32+, NPs-Ca2+: metal–TA-coated zein/CMCS nanoparticles prepared at a zein:CMCS ratio of 1:1 w/w with the final metal ion concentration of 0.24 mM (Cu12+ or Ca2+), 0.48 mM (Cu22+) and 0.72 mM (Cu32+).
Abbreviations: CMCS, carboxymethyl chitosan; NPs, nanoparticles; TA, tannic acid.
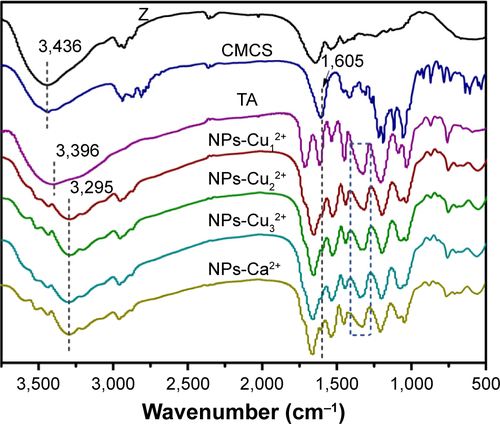
Figure S2 XPS survey spectra of Z1/CMCS1-TA/Cu12+ (A) and Z1/CMCS1-TA/Ca2+ (B).
Notes: The Z1/CMCS1 NPs were prepared at zein:CMCS ratio of 1:1 w/w with the final metal ion concentration of 0.24 mM (Cu12+ or Ca2+).
Abbreviations: CMCS, carboxymethyl chitosan; TA, tannic acid; XPS, X-ray photoelectron spectroscopy; Z1, zein1.
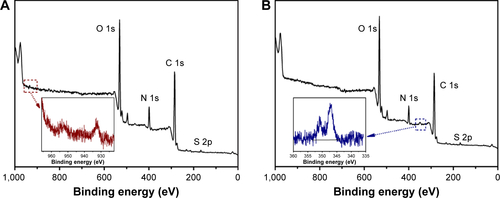
Table S1 Characterization of NPs (pH 7.4)
Table S2 Characterization of NPs (pH 7.4)
Table S3 Characterization of NPs (pH 7.4)
Table S4 Element composition and content on the surface of Z1/CMCS1-TA/Cu12+ NPs and Z1/CMCS1-TA/Ca2+ NPs
Table S5 Characterization of DOX-loaded NPs (pH 7.4)
Table S6 Characterization of DOX-loaded NPs (pH 7.4)
Table S7 Characterization of DOX-loaded NPs (pH 7.4)
Table S8 IC50 values for DOX-loaded NPs against HepG2 cells