Figures & data
Table 1 Nanoparticle formulations developed
Table 2 Characteristics of the nanoparticle formulations prepared
Table 3 Brain biodistribution of rhodamine solution and rhodamine-loaded nanoparticles
Figure 1 Confocal microscopy images of the cerebral cortex.
Notes: Control (A), NPR1 (B), NPR2 (C), and NPR3 (D) obtained at 30 minutes. Control (E), NPR1 (F), NPR2 (G), and NPR3 (H) obtained at 60 minutes.
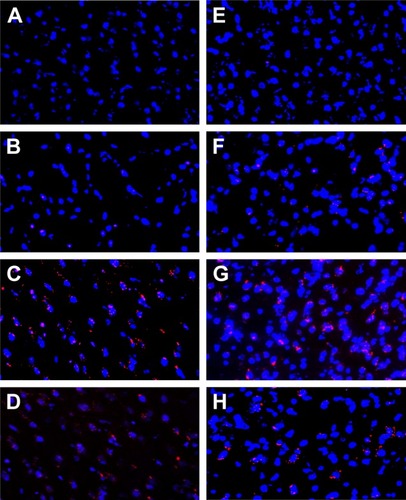
Figure 2 Neuronal cells corresponding to control and treated animal groups (A). Hippocampus sections obtained for control and treatment groups (B): images obtained at 30 minutes for control group treated with Rhodamine solution (a), group trated with formulation NPR1 (b), group treated with formulation NPR2 (c), and group treated with formulation NPR3 (d). Imaged obtained at 60 minutes for control group (e), group treated with formulation NPR1 (f), group treated with formulation NPR2 (g), and group treated with formulation NPR3 (h).
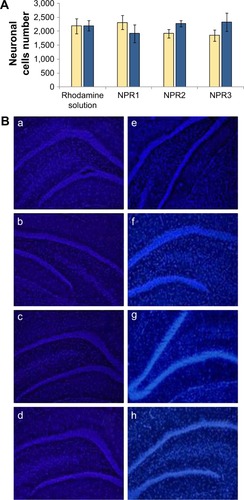
Figure 3 Mean concentrations of rhodamine (Rh) ± standard deviation.
Notes: In the liver and lungs at 30 minutes (A) and 60 minutes (B) after administration of Rh-PLGA NPs. NPR1, Rh-PLGA NPs; NPR2, Rh-PLGA NPs prepared with polysorbate 80; NPR3, Rh-PLGA NPs prepared with Labrafil.
Abbreviations: PLGA, poly(lactic-co-glycolic acid); NPs, nanoparticles.
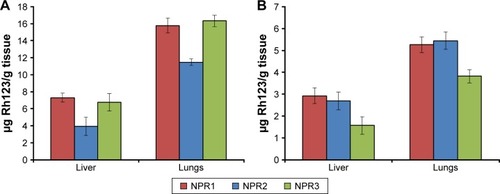
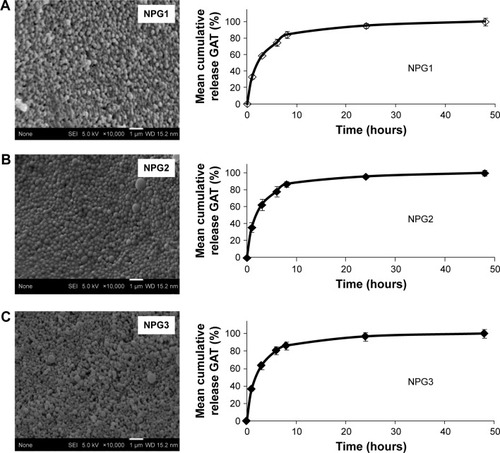
Figure 4 Scanning electron microscopy images and mean in vitro release profiles of Gat.
Notes: From Gat-loaded PLGA NPs (NPG1) (A), Gat-loaded PLGA NPs prepared with polysorbate 80 (NPG2) (B), and Gat-loaded PLGA NPs prepared with Labrafil (NPG3) (C).
Abbreviations: Gat, gatifloxacin; PLGA, poly(lactic-co-glycolic acid); NPs, nanoparticles.