Figures & data
Figure 1 HepG2 cell viability posttreatment with PEI, Lipofectamine, PEG-PLL, or PEG-SS-PLL at various concentrations or mock treatment of PBS.
Notes: *P<0.05. Data expressed as mean ± SD of three experiments. Cell viability was determined relative to the blank group.
Abbreviations: PEI, polyethylenimine; PEG-SS-PLL, polyethylene glycol–poly(ε-benzyloxycarbonyl-l-lysine); PBS, phosphate-buffered saline; SD, standard deviation.
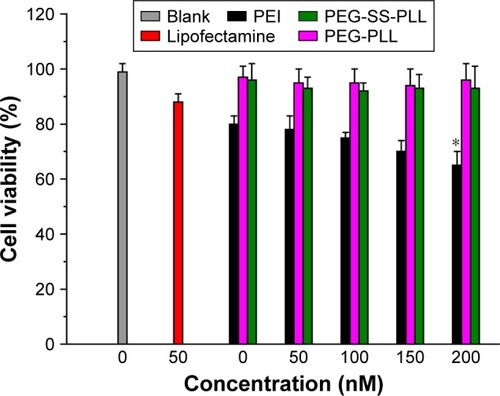
Figure 2 Agarose gel electrophoresis-retardation assay of PEG-SS-PLL/siRNA complex at different weight ratios.
Abbreviations: PEG-SS-PLL, polyethylene glycol–poly(ε-benzyloxycarbonyl-l-lysine); siRNA, small interfering RNA.
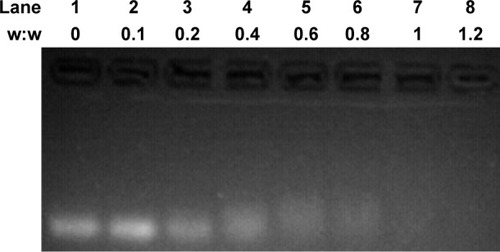
Figure 3 Particle size (A), ζ-potential (B), size distribution (C), and representative TEM image (D) of PEG-PLL/siVEGF and PEG-SS-PLL/siVEGF complexes.
Abbreviations: TEM, transmission electron microscopy; PEG-SS-PLL, polyethylene glycol–poly(ε-benzyloxycarbonyl-l-lysine); siVEGF, small interfering VEGF RNA.
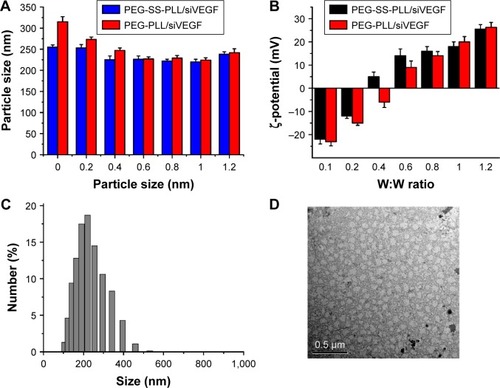
Figure 4 Time-dependent size changes in PEG-SS-PLL/siVEGF complex with a diameter determined by dynamic light scattering.
Note: Eight hours storage (A); exposed to 10 mM GSH (B).
Abbreviations: PEG-SS-PLL, polyethylene glycol–poly(ε-benzyloxycarbonyl-l-lysine); siVEGF, small interfering VEGF RNA; GSH, glutathione.
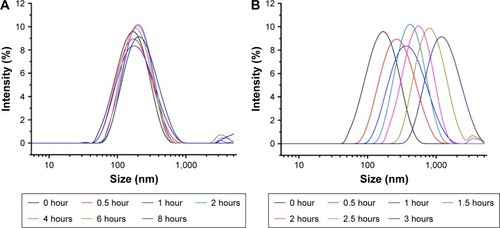
Figure 5 Transfection efficiency of PEG-SS-PLL as an siRNA delivery agent.
Notes: (A–E) Detection of transfection efficiency by fluorescence microscopy. High efficiency of transfection with fluorescent siRNA (green) in HepG2 cells was easily identified at 24 hours posttransfection (100×); (F) detection of transfection efficiency by flow cytometry. Transfection efficiency was up to 85% at 24 hours posttransfection. The histogram shows the enhanced FAM green fluorescence intensity of PEG-SS-PLL/siVEGF group compared to that of siRNA alone, Lipofectamine, and PEG-PLL/siVEGF. Fluorescence-microscopy images show FAM expression in HepG2 cells after silencing by PEG-SS-PLL and PEG-PLL complexes.
Abbreviations: PEG-SS-PLL, polyethylene glycol–poly(ε-benzyloxycarbonyl-l-lysine); siRNA, small interfering RNA; siVEGF, VEGF siRNA.
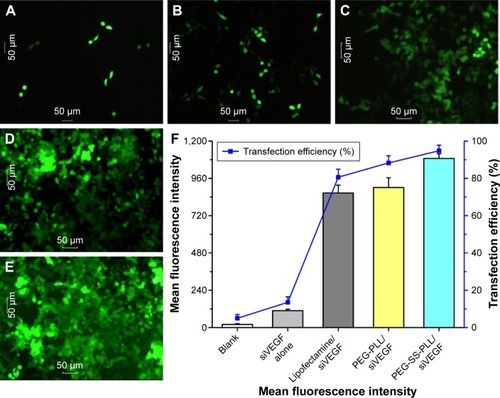
Figure 6 (A–D) Effect of PEG-SS-PLL/siVEGF gene knockdown on the apoptosis of HepG2 cells.
Notes: The results of flow cytometry are expressed as a dot plot, where the longitudinal coordinate was PI and the transverse coordinate was annexin V–FITC. Lower-left quadrants are the annexin V–FITC− PI− double-negative cell group, representing normal cells, lower-right quadrants are the annexin V–FITC+ PI− single-positive cell group, representing early apoptotic cells, and upper right quadrants are the annexin V–FITC+ PI+ double-positive cell group, representing late apoptotic cells or dead cells. The results of flow cytometry are expressed as percentages. The degree of cell apoptosis was analyzed by annexin V–FITC/PI double staining. The extent of apoptotic cell death was quantified (D). Data are expressed as mean ± SD for three individual experiments.
Abbreviations: PEG-SS-PLL, polyethylene glycol–poly(ε-benzyloxycarbonyl-l-lysine); siVEGF, small interfering VEGF RNA; FITC, fluorescein isothiocyanate; PI, propidium iodide; SD, standard deviation.
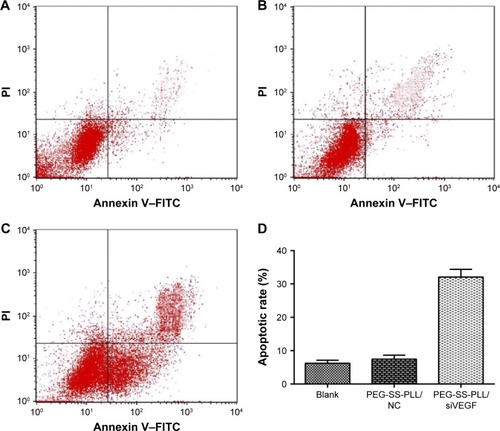
Figure 7 Effect of PEG-SS-PLL/siVEGF complex on tumor growth in vivo.
Notes: (A) Male BALB/c mice (five per group) with established HepG2 tumors were intravenously injected with the complex every other day five times. Tumor size was measured twice a week. Data are shown as mean ± SD, n=5. *P<0.05, **P<0.01 for PEG-SS-PLL/siVEGF versus control group. (B) Representative images show that the tumors in the PEG-SS-PLL/siVEGF group were remarkably smaller on the day 28 after tumor cell inoculation than those of the PBS, PEG-SS-PLL/siLuc, and PEG-PLL/siVEGF groups.
Abbreviations: PEG-SS-PLL, polyethylene glycol–poly(ε-benzyloxycarbonyl-l-lysine); siVEGF, small interfering VEGF RNA; SD, standard deviation; PBS, phosphate-buffered saline.
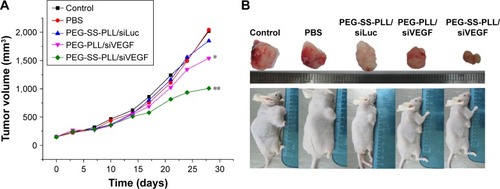
Figure 8 Relative levels of VEGF.
Notes: (A, C) VEGF mRNA by real-time PCR in vitro and (B, D) in vivo; (E) VEGF protein by ELISA in vitro and (F) in vivo.
Abbreviations: mRNA, messenger RNA; PCR, polymerase chain reaction; ELISA, enzyme-linked immunosorbent assay; PEG-SS-PLL, polyethylene glycol–poly(ε-benzyloxycarbonyl-l-lysine); siVEGF, small interfering VEGF RNA; PBS, phosphate-buffered saline.
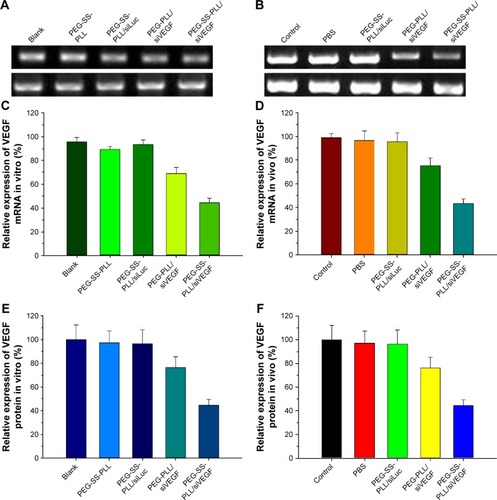
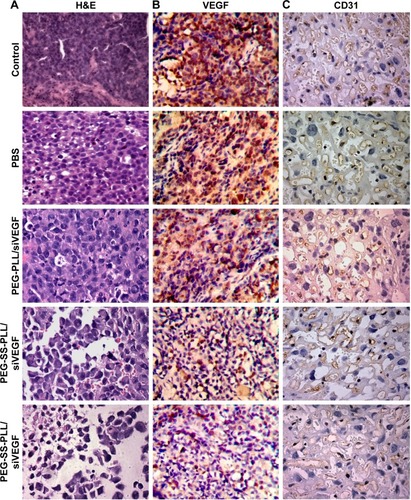
Figure 9 Tumor growth and expression of VEGF and CD31 by immunohistochemistry.
Notes: Tumor-bearing mice were killed 28 days after initial injection, then tumor tissues were collected and processed for paraffin-embedded sections and immunohistochemical staining (n=5). Brown staining in the tissue sections shows positive expression of VEGF or CD31. Images 400×. (A) H&E staining shows inhibition of tumor growth after intravenous tail injection of PEG-SS-PLL/siVEGF complex compared to control, PBS, PEG-SS-PLL/siLuc, and PEG-PLL/siVEGF groups; (B) VEGF staining shows levels of different types of VEGF-protein expression; (C) CD31 staining shows levels of CD31-protein expression, in contrast to control, PBS, PEG-SS-PLL/siLuc, and PEG-PLL/siVEGF groups.
Abbreviations: H&E, hematoxylin and eosin; PEG-SS-PLL, polyethylene glycol–poly(ε-benzyloxycarbonyl-l-lysine); siVEGF, small interfering VEGF RNA; mRNA, messenger RNA; PCR, polymerase chain reaction; ELISA, enzyme-linked immunosorbent assay; PBS, phosphate-buffered saline.
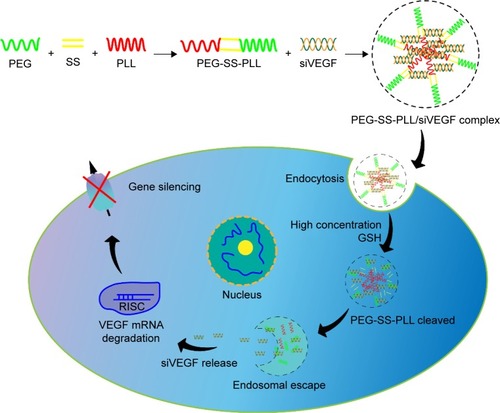
Scheme 1 Illustration of PEG-SS-PLL catiomer for siVEGF encapsulation and intracellular stimulus-responsive siVEGF release.
Abbreviations: PEG-SS-PLL, polyethylene glycol-poly(ε-benzyloxycarbonyl-l-lysine); siVEGF, small interfering VEGF RNA; GSH, glutathione; RISC, RNA-induced silencing complex; mRNA, messenger RNA.