Figures & data
Table 1 Solubility of baicalein in various vehicles
Figure 1 Chemical structure of baicalein.
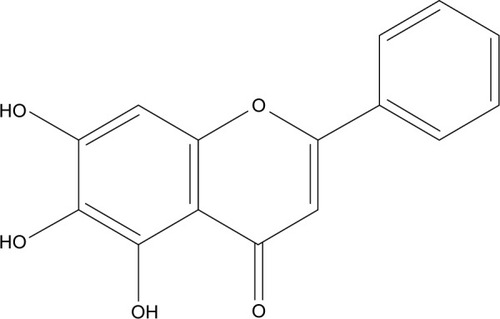
Figure 2 Effects of ratios of drug/excipients (A) and surfactants/oil (B) as well as homogenization cycle (C) with 20,000 psi on the particle size of BCL-NEs (mean ± StD, n=3), in which one factor was set as independent variable keeping other two factors as invariant. *P<0.05; **P<0.01.
Abbreviations: BCL, baicalein; NEs, nanoemulsions; StD, standard deviation.
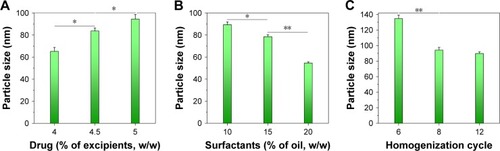
Figure 3 Physical characterization of BCL-NEs: (A) size distribution, (B) appearance, and (C) TEM micrograph.
Abbreviations: BCL, baicalein; NEs, nanoemulsions; TEM, transmission electron microscopy.
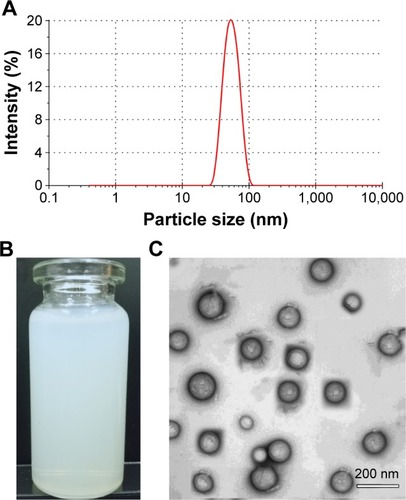
Figure 4 Release profiles of BCL from nanoemulsions with the time in water, 0.1 M HCl, and PBS, pH 6.8 (n=3, mean ± StD).
Abbreviations: BCL, baicalein; PBS, phosphate-buffered saline; StD, standard deviation.
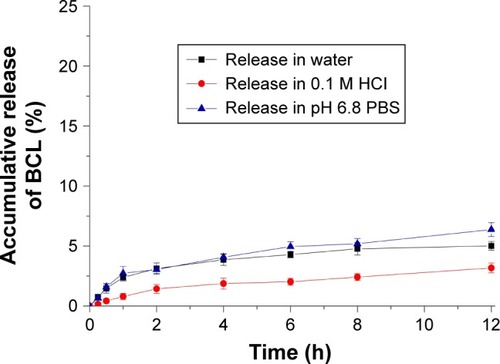
Table 2 Pharmacokinetic parameters of BCL in rats following oral administration of BCL suspensions, BCL emulsions, and BCL-NEs
Figure 5 Pharmacokinetic profiles of BCL in Sprague-Dawley rats following oral administration of BCL suspensions, BCL conventional emulsions, and BCL-NEs (n=6, mean ± StD).
Abbreviations: BCL, baicalein; NEs, nanoemulsions; StD, standard deviation.
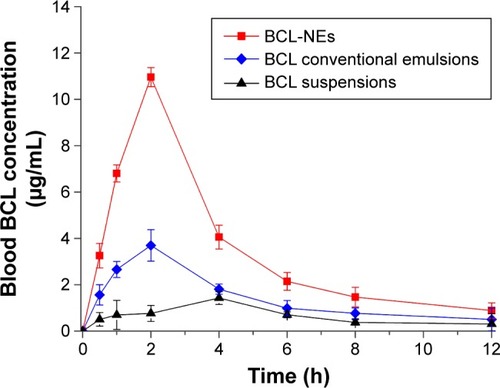
Table 3 Effective intestinal permeability (Peff) of free BCL and encapsulated BCL in NEs determined by the in situ single-pass intestinal perfusion
Figure 6 Cellular uptake of free BCL and BCL-NEs determined by the intracellular drug level (A) (mean ± StD, n=3) and cellular internalization of BCL-NEs evaluated by the CLSM imaging (B). *P<0.05; **P<0.01.
Abbreviations: BCL, baicalein; CLSM, confocal laser scanning microscopy; NEs, nanoemulsions; StD, standard deviation.
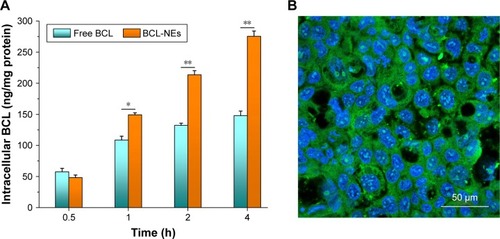
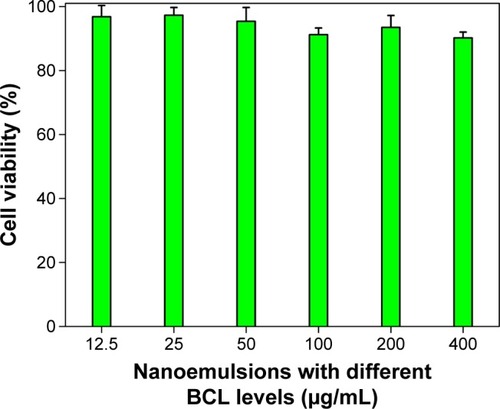
Figure 7 Relative cell viability of Caco-2 incubated with nanoemulsions with different BCL levels (n=3, mean ± StD).
Abbreviations: BCL, baicalein; StD, standard deviation.
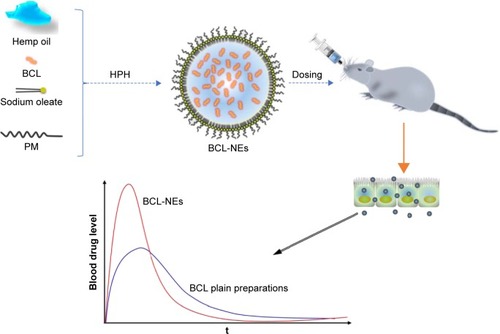
Scheme 1 Illustrative diagram of the preparation of NEs and the oral delivery of BCL.
Abbreviations: BCL, baicalein; HPH, high-pressure homogenization; NEs, nanoemulsions; PM, poly(ethylene glycol) monooleate.