Figures & data
Figure 1 Schematic diagram of the work flow.
Abbreviations: MI, myocardial infarction; PEG, poly(ethylene glycol); PLGA, poly(lactic-co-glycolic acid).
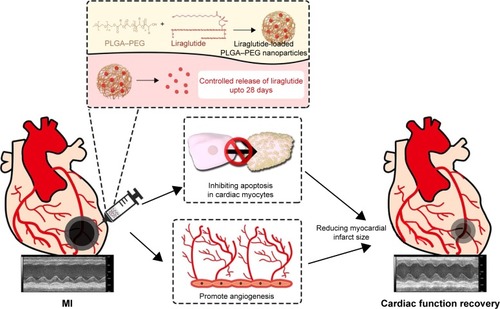
Figure 2 Characterization of NP-liraglutide.
Notes: (A) Transmission electron microscopic images of the NP-liraglutide. Scale bar, 250 nm. (B) The size and zeta potential distribution of NP-liraglutide measured by DLS. (C) In vitro cumulative release profiles of liraglutide from NP-liraglutide (n=3). The percentage of cumulative released liraglutide was calculated as follows: (cumulative released liraglutide at a given time point/total amount of liraglutide) ×100%. Data are shown as mean ± SEM of three samples per time points. (D) Induction of AKT phosphorylation in neonatal rat cardiomyocyte cultures by liraglutide released from the NP-liraglutide. Representative Western blots of cardiomyocyte cultures treated with the only medium, released medium from the NP-liraglutide, medium from empty NPs or medium with direct addition of liraglutide. (E) Densitometric analysis for phosphorylation level of AKT protein kinase based on Western blot. Columns in graph were expressed as the ratio of phosphorylated to total protein signal intensity from three independent experiments. Data are shown as mean ± SEM, *P<0.05. NP-liraglutide: liraglutide loaded in PLGA–PEG NPs.
Abbreviations: DLS, dynamic light scattering; NP, nanoparticle; PEG, poly(ethylene glycol); PLGA, poly(lactic-co-glycolic acid); SEM, standard error of the mean.
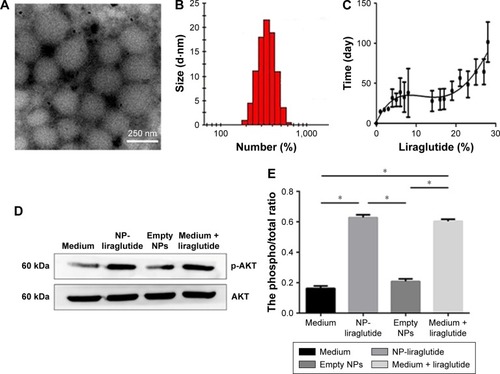
Figure 3 NPs maintaining in the myocardium.
Notes: Representative images show the merging of fluorescent (showing rhodamine NPs in red) and blue field images (showing cell nuclei in blue) at 1-, 3-, 5-, 7-, 14-, 21- and 28-day time points. Scale bars, 100 µm. Inset pictures are cross sections of representative images.
Abbreviation: NPs, nanoparticles.
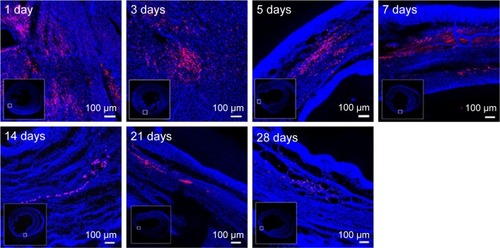
Figure 4 Echocardiographic assessments.
Notes: (A) Representative echocardiographic images from each group 4 weeks after treatment. The LVEF (B), LVFS (C), LVIDs (D) and LVIDd (E) were assessed via two-dimensional echocardiography. Data are shown as mean ± SEM, *P<0.05. NP-liraglutide: liraglutide loaded in PLGA–PEG NPs.
Abbreviations: LVEF, left ventricular ejection fraction; LVFS, left ventricular fractional shortening; LVIDd, left ventricular internal diastolic dimension; LVIDs, left ventricular internal systolic dimension; NP, nanoparticle; PEG, poly(ethylene glycol); PLGA, poly(lactic-co-glycolic acid); SEM, standard error of the mean.
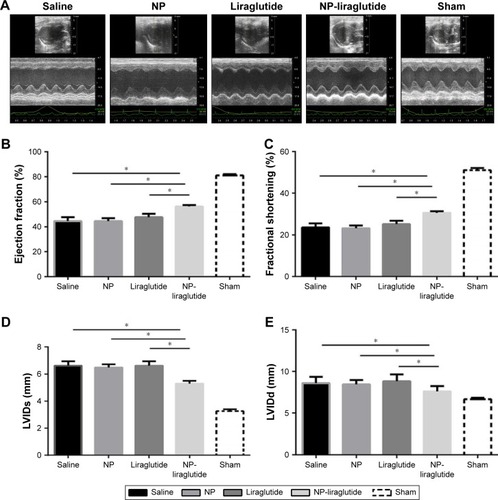
Figure 5 Morphological analysis.
Notes: Morphological analysis of the left ventricle among the different groups. (A) Representative H&E staining and Masson’s trichrome staining. Scale bars, 2 mm. Quantification of the relative scar thickness (B) and infarct expansion index (C) based on Masson’s trichrome staining. Data are shown as mean ± SEM, *P<0.05. NP-liraglutide: liraglutide loaded in PLGA–PEG NPs.
Abbreviations: NP, nanoparticle; PEG, poly(ethylene glycol); PLGA, poly(lactic-co-glycolic acid); SEM, standard error of the mean.
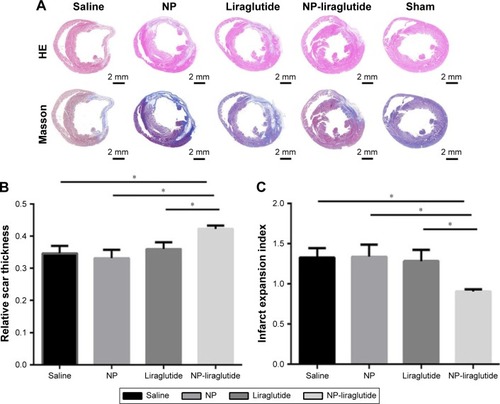
Figure 6 Immunofluorescence assessment of the vascularization 4 weeks after treatment.
Notes: (A) Representative immunohistochemical staining of blood vessel SMA and ECs in the peri-infarct myocardial tissue. CD31 (red) and α-SMA (green) staining for the blood vessels. Scale bars, 100 µm. Quantification of the capillary density (B) and maturation index (C). Increased capillary density and maturation index are shown in the group treated with the NP-liraglutide relative to the changes in the other groups. Data are shown as mean ± SEM, *P<0.05. NP-liraglutide: liraglutide loaded in PLGA–PEG NPs.
Abbreviations: ECs, endothelial cells; NP, nanoparticle; PEG, poly(ethylene glycol); PLGA, poly(lactic-co-glycolic acid); SEM, standard error of the mean; SMA, smooth muscle actin.
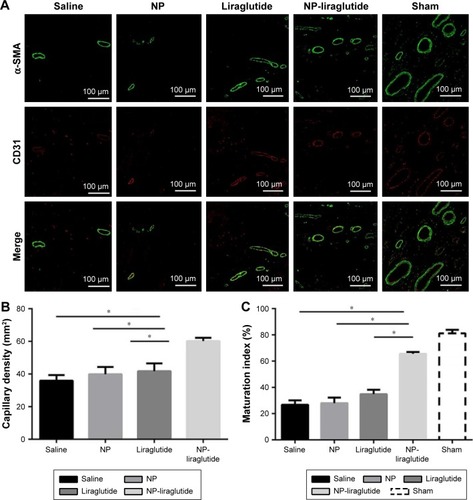
Figure 7 The liraglutide reduces cardiac cell apoptosis after MI.
Notes: (A) Representative photomicrographs of TUNEL staining (green) and DAPI (blue) staining for the saline, NP, liraglutide, NP-liraglutide and sham groups in peri-infarct region. Scale bars, 50 µm. (B) Quantification of the percentage of TUNEL-positive nuclei. Data are shown as mean ± SEM, *P<0.05. NP-liraglutide: liraglutide loaded in PLGA–PEG NPs.
Abbreviations: DAPI, 4-6-diamidino-2-phenylindole; MI, myocardial infarction; NP, nanoparticle; PEG, poly(ethylene glycol); PLGA, poly(lactic-co-glycolic acid); SEM, standard error of the mean; TUNEL, terminal deoxynucleotidyl transferase dUTP nick-end labeling.
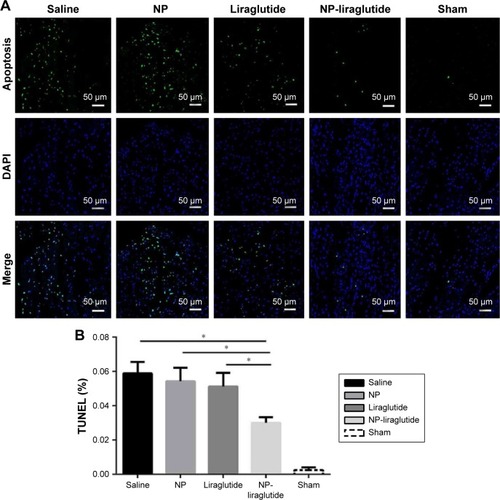
Figure S1 Echocardiographic assessments.
Notes: (A) Representative echocardiographic images from each group 2 days after ligation. The LVEF (B), LVFS (C), LVIDs (D) and LVIDd (E) were assessed via two-dimensional echocardiography. The change in each measurement is summarized. Data are shown as mean ± SEM. NP-liraglutide: liraglutide loaded in PLGA–PEG NPs.
Abbreviations: LVEF, left ventricular ejection fraction; LVFS, left ventricular fractional shortening; LVIDs, left ventricular internal systolic dimension; LVIDd, left ventricular internal diastolic dimension; NP, nanoparticle; PEG, poly(ethylene glycol); PLGA, poly(lactic-co-glycolic acid); SEM, standard error of the mean.
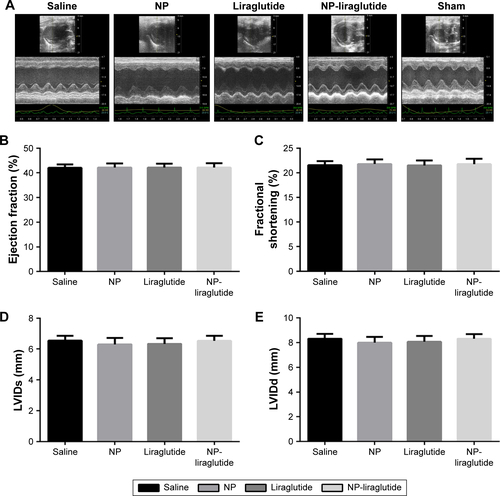
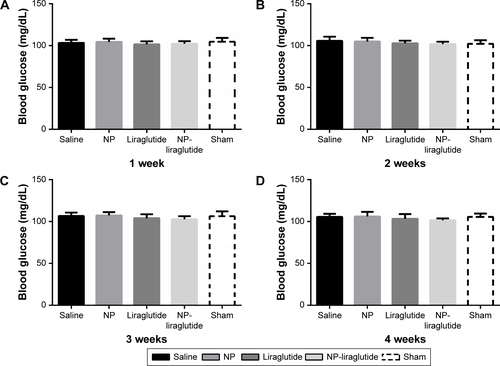
Figure S2 Blood glucose levels.
Notes: The blood glucose was measured at 1 week (A), 2 weeks (B), 3 weeks (C) and 4 weeks (D). NP-liraglutide had no significant effects on random blood glucose levels among different groups. Data shown as mean ± SEM.
Abbreviations: NP, nanoparticle; SEM, standard error of the mean.