Figures & data
Figure 1 Photographs of AgNO3/talc suspension (A0) and silver-talc nanocomposite suspension at different AgNO3 concentrations, ie, (A1) 0.5%, (A2) 1.0%, (A4) 2.0%, and (A5) 5%.
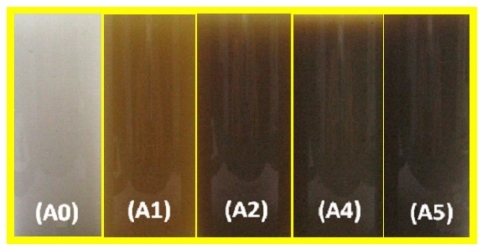
Figure 2 Ultraviolet-visible absorption spectra of silver-talc nanocomposite suspensions for different AgNO3 concentrations, ie, (A1) 0.5%, (A2) 1.0%, (A3) 1.5%, (A4) 2.0%, (A5) 5%, and (A0) AgNO3/talc suspension in the absence of NaBH4.
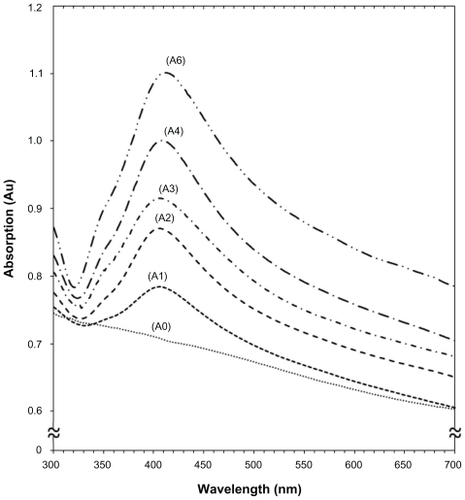
Figure 3 Transmission electron microscopy images of (A) pure talc and (B) talc after impregnation with aqueous AgNO3 (AgNO3/talc, A0).
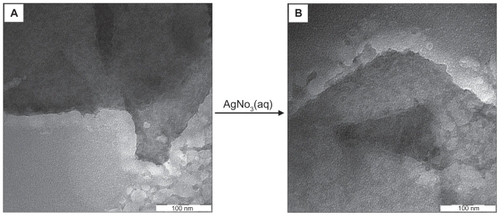
Figure 4 Transmission electron microscopy images and corresponding particle size distribution of silver-talc nanocomposites at different AgNO3 concentrations [(A2) 1.0% (A–B), (A4) 2.0% (C–D) and (A5) 5.0% (E–F)].
![Figure 4 Transmission electron microscopy images and corresponding particle size distribution of silver-talc nanocomposites at different AgNO3 concentrations [(A2) 1.0% (A–B), (A4) 2.0% (C–D) and (A5) 5.0% (E–F)].](/cms/asset/78fb3954-9d99-4da7-a4d4-a329620a7150/dijn_a_12184718_f0004_c.jpg)
Figure 5 Scanning electron microscopy micrographs of the talc (A) and silver-talc nanocomposites at different AgNO3 concentrations [(A2) 1.0% (B), (A4) 2.0% (C), and (A5) 5.0% (D)].
![Figure 5 Scanning electron microscopy micrographs of the talc (A) and silver-talc nanocomposites at different AgNO3 concentrations [(A2) 1.0% (B), (A4) 2.0% (C), and (A5) 5.0% (D)].](/cms/asset/d76106e3-7e2c-4eb1-a495-0bc115ffe723/dijn_a_12184718_f0005_b.jpg)
Figure 6 Powder X-ray diffraction patterns of talc and silver-talc nanocomposites for determination of d-spacing (ds) at different AgNO3 concentrations [0.5%, 1.0%, 1.5%, 2.0% and 5.0% (A1–A5), respectively].
![Figure 6 Powder X-ray diffraction patterns of talc and silver-talc nanocomposites for determination of d-spacing (ds) at different AgNO3 concentrations [0.5%, 1.0%, 1.5%, 2.0% and 5.0% (A1–A5), respectively].](/cms/asset/9bedd7b5-0545-4613-93af-c26f76bbb755/dijn_a_12184718_f0006_c.jpg)
Figure 7 Powder X-ray diffraction patterns of talc and silver-talc nanocomposites for determination of silver crystals at different AgNO3 concentrations [0.5%, 1.0%, 1.5%, 2.0% and 5.0% (A1–A5), respectively].
![Figure 7 Powder X-ray diffraction patterns of talc and silver-talc nanocomposites for determination of silver crystals at different AgNO3 concentrations [0.5%, 1.0%, 1.5%, 2.0% and 5.0% (A1–A5), respectively].](/cms/asset/f4050710-29bb-405b-b20f-39342b1db775/dijn_a_12184718_f0007_c.jpg)
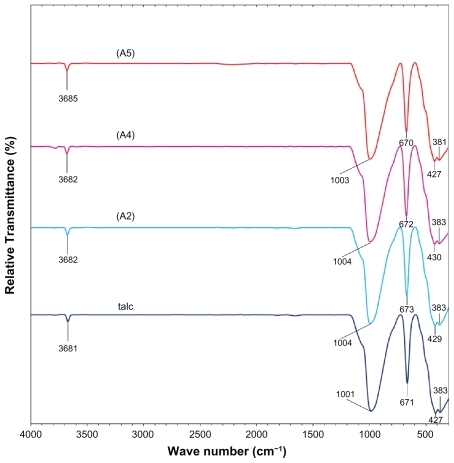
Figure 8 Fourier transform infrared spectra of talc and silver-talc nanocomposites at 1 (A2), 2 (A4) and 5 (A5) wt% silver nanoparticles.