Figures & data
Figure 1 The cartoon depiction and the physicochemical parameters of four AgNPs tested in this study.
Abbreviations: AgNPs, silver nanoparticles; Cit, citrate; MPA, mercaptopropionic acid; MHA, mercaptohexanoic acid; MPS, mercaptopropionic sulfonic acid; SPR, surface plasmon resonance; TEM, transmission electron microscope.
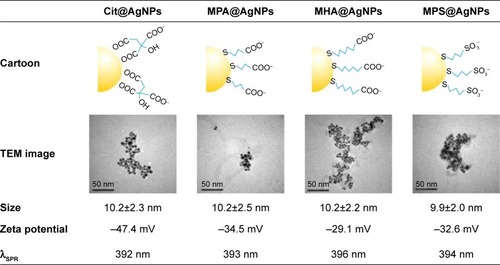
Figure 2 The surface ligand regulates silver ion release from AgNPs in both concentration- and incubation time-dependent manners.
Notes: The incubation lasted for (A) 6 h and (B) 24 h. *P<0.05 versus the blank control.
Abbreviations: AgNPs, silver nanoparticles; Cit, citrate; MPA, mercaptopropionic acid; MHA, mercaptohexanoic acid; MPS, mercaptopropionic sulfonic acid.
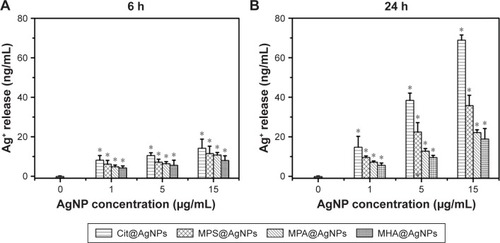
Figure 3 The viabilities of E. coli after 6-h exposures of different AgNPs.
Notes: (A) AgNP treatment alone, (B) The coexposure of AgNPs and 1 mM GSH, (C) The coexposure of AgNPs and 0.1 mM Na2S2O3, and (D) The exposure of Ag+ in the absence or presence of 1 mM GSH or 0.1 mM Na2S2O3. aDenotes significant difference between each AgNP exposure group and the negative control (P<0.05). bDenotes significant difference between each AgNP (1 μg/mL) plus GSH or Na2S2O3 coexposure group and 1 μg/mL AgNP exposure alone (P<0.05). cDenotes significant difference between each AgNP (5 μg/mL) plus GSH or Na2S2O3 coexposure group and 5 μg/mL AgNP exposure alone (P<0.05). dDenotes significant difference between each AgNP (15 μg/mL) plus GSH or Na2S2O3 coexposure group and 15 μg/mL AgNP exposure alone (P<0.05).
Abbreviations: E. coli, Escherichia coli; AgNP, silver nanoparticle; Cit, citrate; GSH, glutathione; MPA, mercaptopropionic acid; MHA, mercaptohexanoic acid; MPS, mercapto-propionic sulfonic acid.
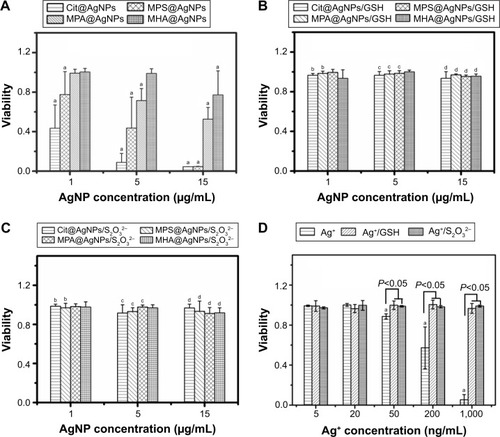
Figure 4 Silver ions perturb bacterial respiratory chain, inducing intracellular ROS generation.
Notes: (A) Total Ag uptake in E. coli (left panel) and its distribution (right panel); (B) alteration of NAD+/NADH ratio in E. coli with different treatments as indicated, *P<0.05 versus the negative control; and (C) the intracellular ROS generation. The concentrations of Cit@AgNPs, AgNO3, GSH, and Na2S2O3 were 15 μg/mL, 0.5 μg/mL, 1.0 mM, and 0.1 mM, respectively, *P<0.05 versus the negative control. The exposure lasted for 6 h.
Abbreviations: AgNPs, silver nanoparticles; GSH, glutathione; ROS, reactive oxygen species; E. coli, Escherichia coli; Cit, citrate; MPA, mercaptopropionic acid; MHA, mercaptohexanoic acid; MPS, mercaptopropionic sulfonic acid.
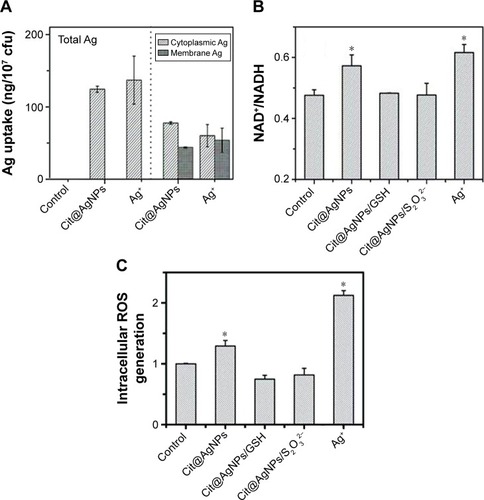
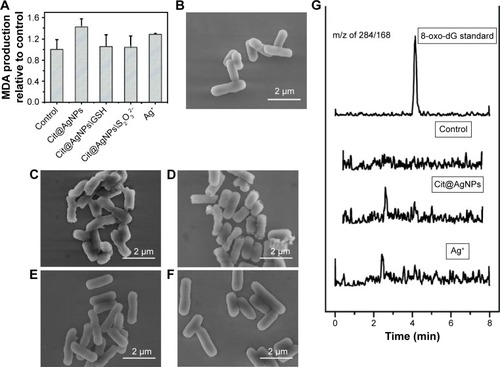
Figure 5 Oxidative damage and morphological changes in E. coli stimulated by Cit@AgNPs.
Notes: (A) MDA production. Scanning electron microscopic images of E. coli samples from the control (B), Cit@AgNPs (C), Ag+ (D), Cit@AgNPs plus 1 mM GSH (E), and Cit@AgNPs plus 0.1 mM Na2S2O3 (F). (G) 8-oxo-dG generation in E. coli with different treatments as indicated. The concentrations of Cit@AgNPs and AgNO3 were 15 and 0.5 μg/mL, respectively. The exposure lasted for 6 h.
Abbreviations: 8-oxo-dG, 8-oxoguanine; AgNPs, silver nanoparticles; E. coli, Escherichia coli; GSH, glutathione; MDA, malonyldialdehyde; Cit, citrate; MPA, mercaptopropionic acid; MHA, mercaptohexanoic acid; MPS, mercaptopropionic sulfonic acid.
Scheme 1 The ligands regulate the antibacterial activities of AgNPs by controlling Ag+ release and oxidative stress through a Trojan-horse-type mechanism.
Notes: More specifically, the internalized AgNPs release Ag+ in a ligand-dependent manner, perturb the membrane respiratory chain, cause excessive ROS generation, lipid peroxidation, and loss of the plasma membrane integrity, thus exerting antibacterial properties.
Abbreviations: AgNPs, silver nanoparticles; ROS, reactive oxygen species; Cit, citrate; MPA, mercaptopropionic acid; MHA, mercaptohexanoic acid; MPS, mercaptopropionic sulfonic acid.
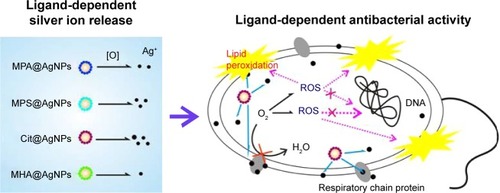
Figure S1 Growth curve of E. coli MG1655 in LB growth medium.
Abbreviations: E. coli, Escherichia coli; LB, Luria–Bertani; OD600, optical density at 600 nm.
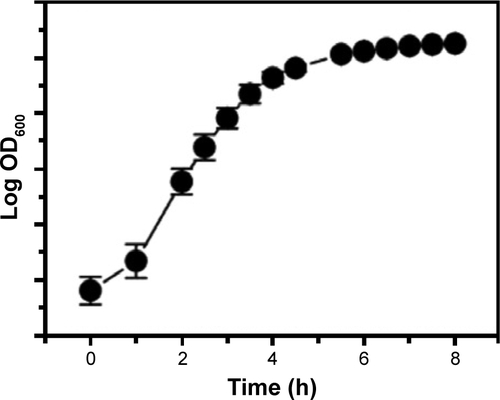
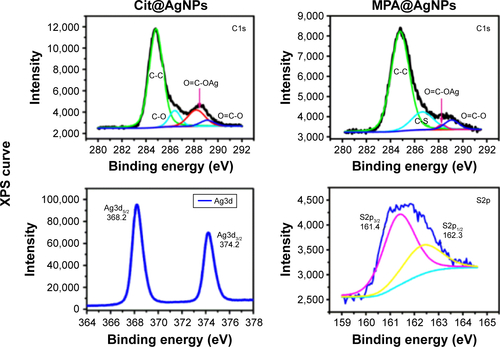
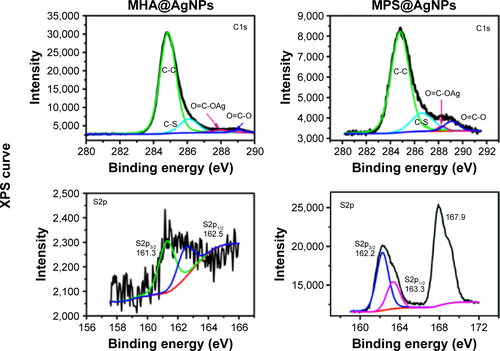
Figure S2 XPS spectrum of AgNPs with four surface ligands, including Cit, MPA, MHA, and MPS.
Abbreviations: AgNPs, silver nanoparticles; Cit, citrate; MPA, mercaptopropionic acid; MHA, mercaptohexanoic acid; MPS, mercaptopropionic sulfonic acid; XPS, X-ray photoelectron spectroscopy.