Figures & data
Figure 1 SEM image of topography of the triangular Ag nanoparticles fabricated by nanosphere lithography (×50,000).
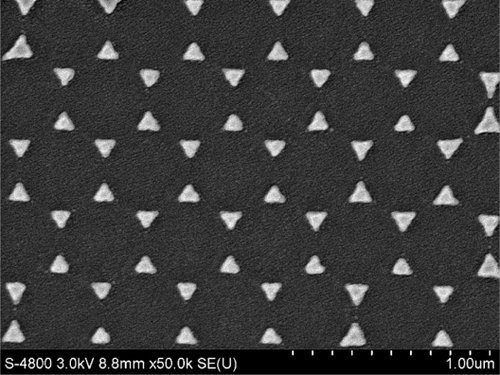
Figure 2 A schematic illustration of the prefunction for the nanoparticles surface. Four chemical structures: A) EDC·HCl; B) S-NHS; C) 1-OT; D) 11-MUA. E) A mixed monolayer of 1-OT and 11-MUA is formed on the exposed surfaces of the Ag nanoparticles. EDC is a zero length coupling agent and can couple the amine groups on the antibody to the carboxyl groups on 11-MUA.
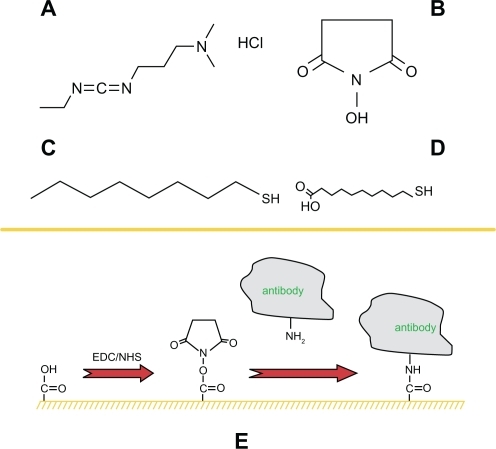
Figure 3 A schematic representation of the LSPR-based nanobiosensor depicting its exposure to human samples.
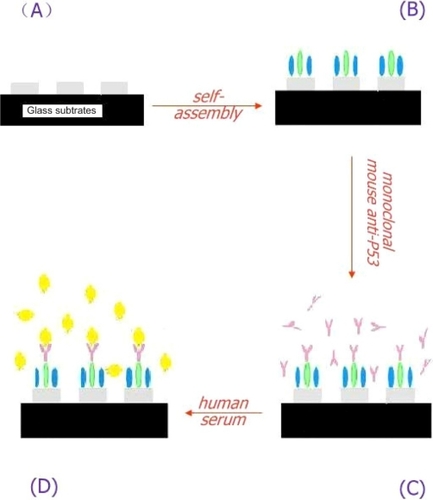
Figure 4 Schematic representation of integrate LSPR nanobiosensor. The sensor chip is loaded by substrate holder (on the top of the system).
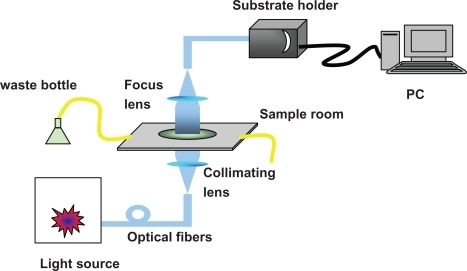
Figure 5 Design of the LSPR biosensor for serum p53 protein detection in control. A) Ag nanoparticles before chemical modification,λmax = 588.2 nm; B) Ag nanoparticles after modification with 11-MUA/1-OT, λmax = 623.5 nm; C) The chip with 2 μg/mL mouse monoclonal p53 antibody, λmax = 673.84 nm; D) The biochip after incubation with control serum sample, λmax = 676.08 nm. All extinction measurements were collected at room temperature.
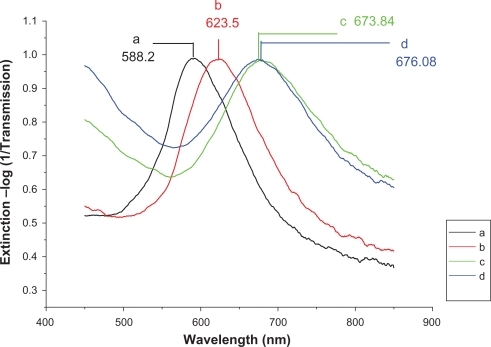
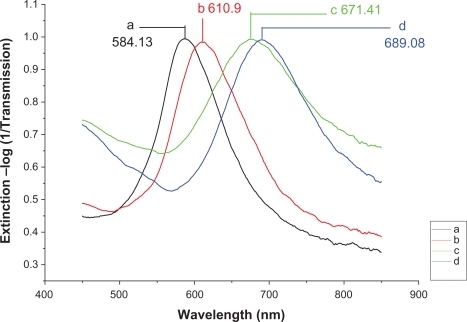
Figure 6 Design of the LSPR biosensor for serum p53 protein detection in HNSCC. A) Ag nanoparticles before chemical modification, λmax = 584.13 nm; B) Ag nanoparticles after modification with 11-MUA/1-OT, λmax = 610.9 nm; C) The chip with 2 μg/mL mouse monoclonal p53 antibody, λmax = 671.41 nm; D) The biochip after incubation with HNSCC serum sample, λmax = 689.08 nm. All extinction measurements were collected at room temperature.