
Figures & data
Figure 1 Intracellular ATP concentrations during CdSe QDs biosynthesis.
Notes: (A) ATP concentrations during the 12-hour incubation with Na2SeO3; (B) ATP concentrations at different collection times during the whole process, from the cells in exponential phase to 24 hours after seleniumized cells were co-incubated with CdCl2. Vertical lines divide the process into three phases. The cell’s growing phase is from 0 to 24 hours; Na2SeO3 was added at 24 hours. At 48 hours, cell pellets were transferred to fresh medium and CdCl2 was added to the culture.
Abbreviations: OD, optical density; QDs, quantum dots.
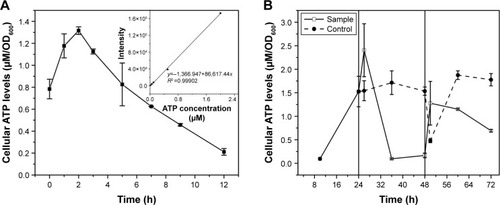
Figure 2 (A) Intracellular fluorescence intensities and (B) ATP concentrations of WT and Δatp1 cells, (C) intracellular fluorescence intensities and (D) ATP concentrations of some ATP-synthesis-deficient strains.
Abbreviations: CPS, counts per second; FL, fluorescence; OD, optical density; WT, wild-type.
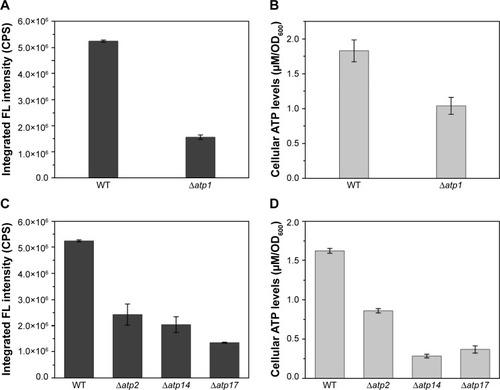
Figure 3 Intracellular GSH contents (A) and intracellular fluorescence intensities (B) of seleniumized WT and Δatp1 cells incubated with CdCl2 during the first 7 hours.
Abbreviations: CPS, counts per second; FL, fluorescence; GSH, glutathione (l-γ-glutamylcysteinylglycine); OD, optical density; WT, wild-type.
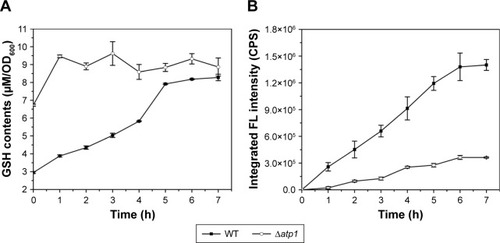
Figure 4 Se (A) and Cd (B) concentrations inside (in) and outside (out) wild-type (WT) and Δatp1 cells, and the recovery rate of total Se or Cd added to the culture. Se/Cd-WT/Δatp1-in/out stands for Se/Cd concentrations inside/outside the WT/Δatp1 cells.
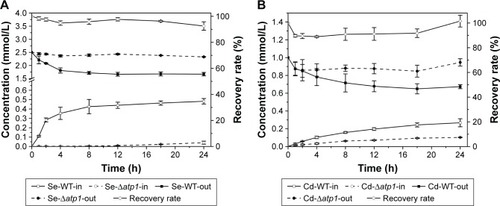
Figure 5 HPLC-ICP-MS chromatogram of Se species standards (ST) and seleno-amino acids characterized from WT and Δatp1 cells after treatment with Na2SeO3. The Se species standards are: 1, l-selenocystine; 2, Se-methylseleno-l-cysteine; 3, d,l-selenomethionine.
Abbreviations: HPLC-ICP-MS, high-performance liquid chromatography–inductively coupled plasma mass spectrometry; WT, wild-type.
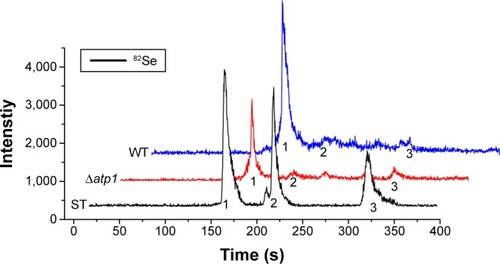
Figure 6 Intracellular fluorescence intensities of WT cells treated with different concentrations of NaN3 (A) or DNP (B), and Cd concentrations in the culture supernatants of cells samples treated with 150 mM NaN3 and 2 mM DNP (C) and when co-incubated with CdCl2.
Abbreviations: DNP, 2,4-dinitrophenol; FL, fluorescence; WT, wild-type.
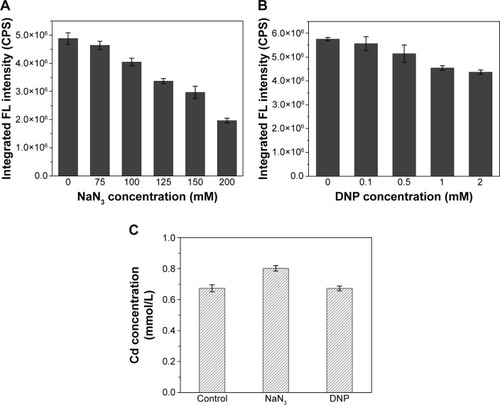
Figure 7 Intracellular ATP concentrations (A) and FL intensities (B) of WT and PGAL1-ADK1 strains.
Notes: The results are expressed as mean ± standard deviation, n=3. *P<0.05.
Abbreviations: FL, fluorescence; OD, optical density; WT, wild-type.
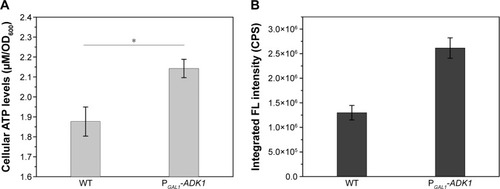
Figure 8 Schematic illustration of the points of action of ATP in the CdSe QDs biosynthesis process in Saccharomyces cerevisiae.
Abbreviations: GSH, glutathione (l-γ-glutamylcysteinylglycine); QDs, quantum dots.
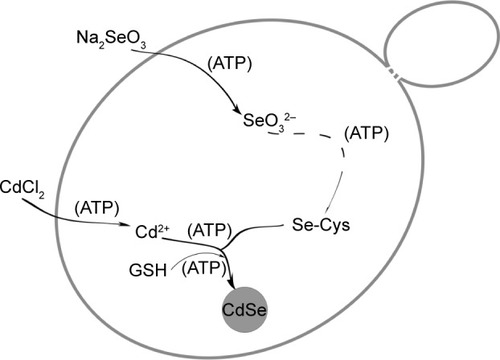
Figure 9 Intracellular fluorescence intensities of WT and PGAL1-SAM2 strains.
Abbreviations: FL, fluorescence; SAM, S-adenosylmethionine; WT, wild-type.
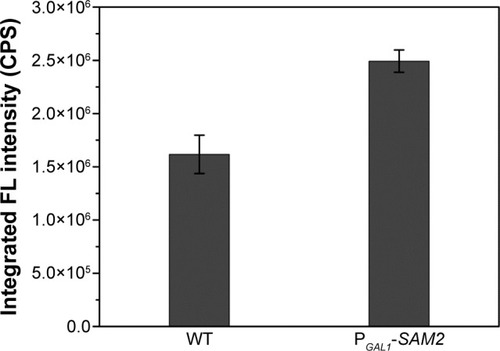
Figure S1 Schematic flow chart of the biosynthetic procedure of the CdSe QDs in Saccharomyces cerevisiae.
Abbreviation: QDs, quantum dots.
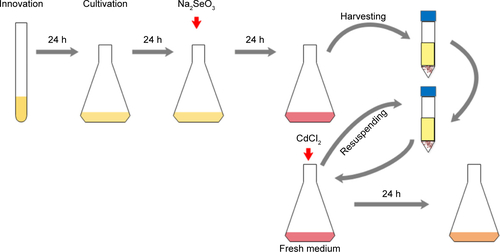
Figure S2 Growth curves of the strains in the present work cultured in YPGlu (A) or YPGal (B).
Abbreviations: OD, optical density; WT, wild-type; YP, 1 g L−1 yeast extract and 2 g L−1 peptone; YPGlu, YP supplied with 2 g L−1 glucose; YPGal, YP supplied with 2 g L−1 galactose.
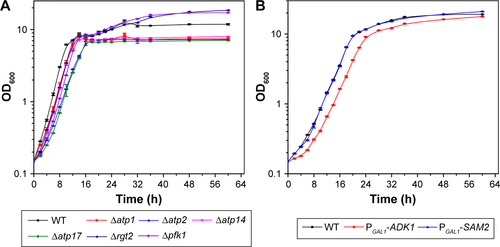
Figure S3 Sugar remaining in the supernatants of different strains after cultivation for 24 hours right before Na2SeO3 was added into the culture.
Abbreviations: A540, absorbance; OD, optical density; WT, wild-type.
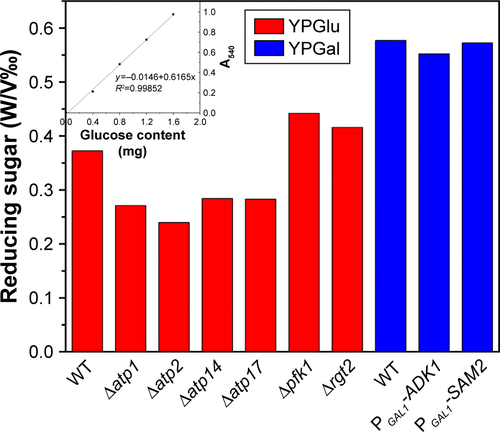
Figure S4 FL intensities (A) and intracellular ATP concentrations (B) of the WT, Δpfk1, and Δrgt2.
Abbreviations: CPS, counts per second; FL, fluorescence; OD, optical density; WT, wild-type.
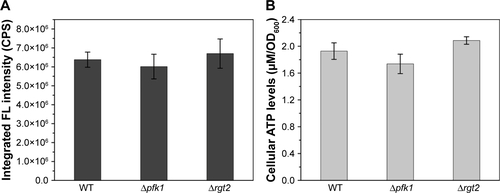
Figure S5 Intracellular ATP concentrations of WT samples and WT cells under the influences of 150 mM NaN3 or 2 mM DNP.
Abbreviations: DNP, 2,4-dinitrophenol; WT, wild-type.
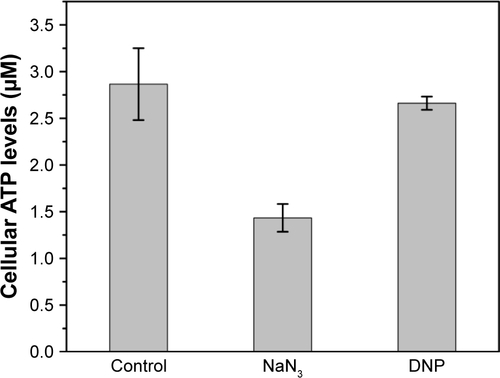
Figure S6 Intracellular ATP concentrations of the WT cells under the effect of 0.2% (wt/vol) 2-dexoglucose (2-DG) added with the introduction of CdCl2. −, blank control without 2-DG; +, 0.2% 2-DG into the culture.
Abbreviations: OD, optical density; WT, wild-type.
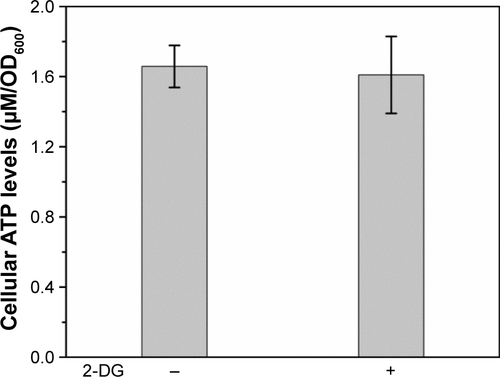
Figure S7 Schematic of the homologous recombination process (A) and diagnostic polymerase chain reaction strategy (B). Gene specific primers CKA and CKB match the upstream and downstream of the insert site on the chromosome; F4 and R2 primers match the inner sequences of the insert DNA.
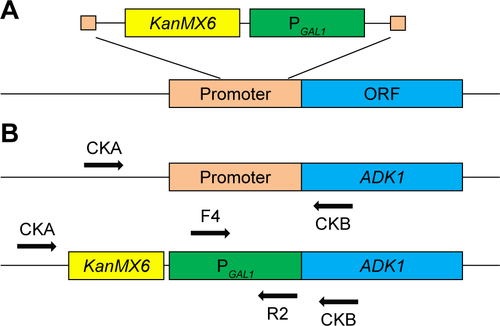
Figure S8 Diagnostic PCR electrophoresis image for confirming the correct replacement of the promoter of the PGAL1-ADK1 strain, the primers used as referred, templates were: 1, transformant genome; 2, WT genome; 3, no template control.
Abbreviation: WT, wild-type.
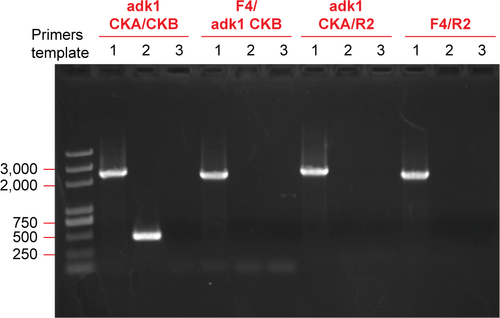
Figure S9 Electrophoresis image of the diagnostic PCR products using the primers referred to in Figure S7; templates were: 1, transformant genome; 2, WT genome; 3, no template control (A), and intracellular SAM concentration of the WT and correct transformant cells (B).
Abbreviations: PCR, polymerase chain reaction; WT, wild-type.
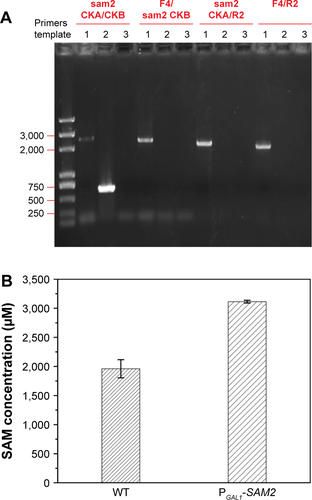
Figure S10 FL intensity of the same WT samples determined three times with a 24 hour interval.
Abbreviations: CPS, counts per second; FL, fluorescence; WT, wild-type.
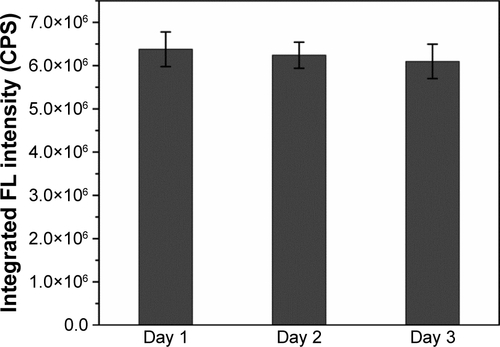
Figure S11 Emission spectrums of the corresponding strains used in the present work cultured in YPGlu (A) or YPGal (B) medium.
Abbreviations: CPS, counts per second; FL, fluorescence; WT, wild-type.
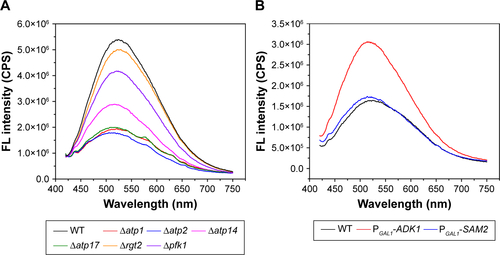
Table S1 List of strains
Table S2 PCR primers used in this study