
Figures & data
Figure 1 (A) Gel electrophoretic analysis of DNA TD (1, 50 bp marker; 2, TD; 3, 1F-TD; 4, 2F-TD; 5, 1SL2B-TD; 6, 2SL2B-TD; 7, 1F/1SL2B-TD; 8, 2F/2SL2B-TD); (B) AFM image of DNA TD (green triangles outline the TD); (C) concentration of loaded DOX by DNA TD with increasing added DOX; (D) concentration of loaded DOX by DNA TD with increasing incubation time.
Abbreviations: TD, tetrahedron; bp, base pair; F, folic acid; AFM, atom force microscopy; DOX, doxorubicin.
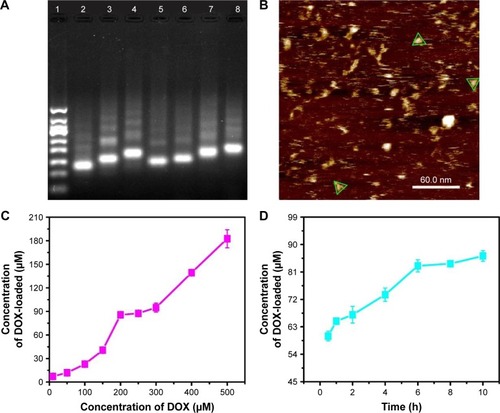
Figure 2 (A) Gel electrophoretic analysis of DOX-loaded DNA TD in McCoy’s 5A medium plus 10% FBS (1, 50 bp marker; 2, TD control; 3, 0 h; 4, 0.5 h; 5, 3 h; 6, 6 h; 7, 15 h; 8, 24 h; 9, 48 h; 10, 72 h); (B) the relative stability of DOX in McCoy’s 5A medium plus 10% FBS; (C) release profiles of DOX, DOX@TD, and DOX@TD-2F2S.
Abbreviations: TD, tetrahedron; bp, base pair; DOX, doxorubicin; FBS, fetal bovine serum; F, folic acid; S, SL2B.
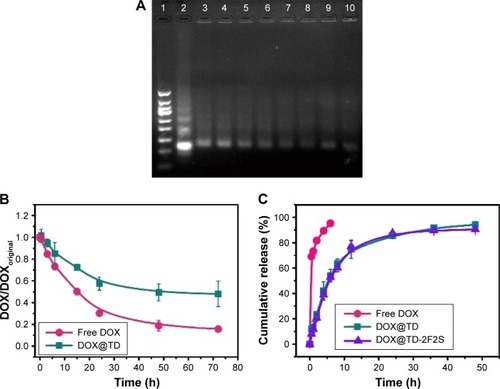
Figure 3 In vitro HT-29 cell inhibition analysis at varied concentrations of the listed treatments at (A) 24 h, (B) 48 h, (C) 72 h, and (D) IC50 values of HT-29 cells by the listed treatments.
Notes: Data presented as mean value ± SD (n=3). *Free DOX vs DOX@TD-2F2S, P<0.01.
Abbreviations: IC50, inhibitory concentration of 50%; DOX, doxorubicin; TD, tetrahedron; F, folic acid; S, SL2B; SD, standard deviation.
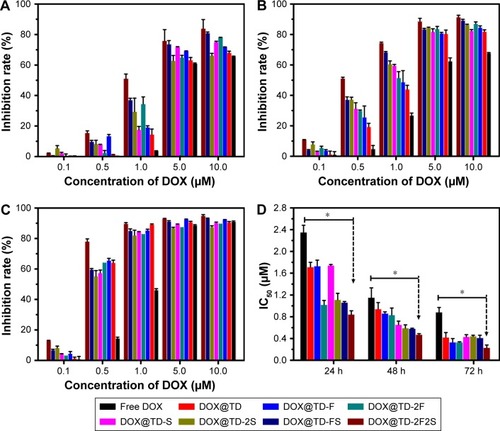
Figure 4 (A) Apoptotic statistics of HT-29 cells after incubation with listed treatments for 48 h; (B) flow cytometry histograms of HT-29 cell cycle after incubation with listed treatments for 48 h.
Abbreviations: DOX, doxorubicin; TD, tetrahedron; F, folic acid; S, SL2B.
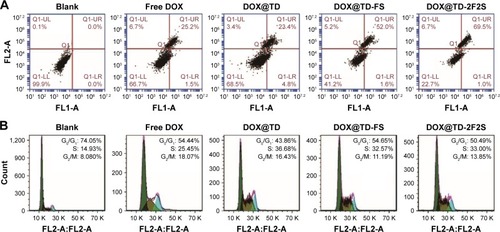
Figure 5 (A) HT-29 cell inhibition by the listed SL2B treatment; (B) HT-29 cell inhibition by the combined DOX and SL2B treatment; (C) Western blotting results for the downregulation of jagged-1 that plays a key role in the Notch signaling pathway; (D) binding affinity curve of SL2B-FITC and TD-1SL2B-FITC with HT-29 cells.
Abbreviations: DOX, doxorubicin; FI, fluorescence intensity; TD, tetrahedron; FITC, fluorescein isothiocyanate.
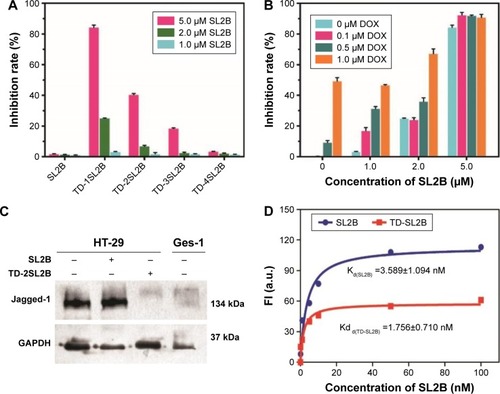
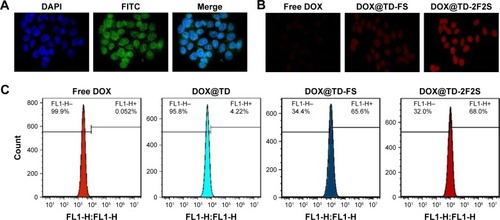
Figure 6 (A) Confocal microscopy images of HT-29 cells after incubation with FITC-labeled TD for 4 h (green FITC represented the location of TD); (B) confocal microscopy images of intracellular uptake of DOX by HT-29 cells after incubation with listed treatments for 2 h; (C) flow cytometry histograms of intracellular DOX uptake after incubation with listed treatments for 1 h.
Abbreviations: DOX, doxorubicin; TD, tetrahedron; FITC, fluorescein isothiocyanate; F, folic acid; S, SL2B.
Scheme 1 Compositions of multifunctional DNA nanostructures and schematic illustration of combined biological effect and chemotherapy for colorectal cancer.
Notes: SL2B binds to VEGF165 and inhibits colorectal cancer cells by interfering subsequent VEGF/Notch signaling pathways. DNA TD can enter the nucleus due to its small diameter. Folate interacts with its receptor and enhanced intracellular delivery of DNA nanostructures by receptor-mediated endocytosis. TD releases DOX in the cytoplasm and nucleus to inhibit cell proliferation. The combined therapy of SL2B and DOX ultimately caused enhanced cell death.
Abbreviations: DOX, doxorubicin; TD, tetrahedron; VEGF, vascular endothelial growth factor.
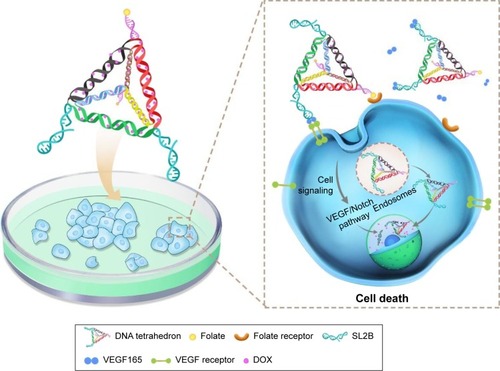
Figure S1 Gel electrophoretic analysis of sediment and supernatant from DOX loading experiment.
Notes: (A) Analysis of sediment (1: 50 bp marker, 2: TD control, 3: 500 μM, 4: 400 μM, 5: 300 μM, 6: 250 μM; 7: 200 μM, 8: 150 μM, 9: 100 μM, 10: 50 μM, 11: 10 μM). (B) Analysis of supernatant (1: 50 bp marker, 2: TD control, 3: 500 μM, 4: 400 μM, 5: 300 μM, 6: 250 μM; 7: 200 μM, 8: 150 μM, 9: 100 μM, 10: 50 μM, 11: 10 μM).
Abbreviations: TD, tetrahedron; DOX, doxorubicin; bp, base-pair.
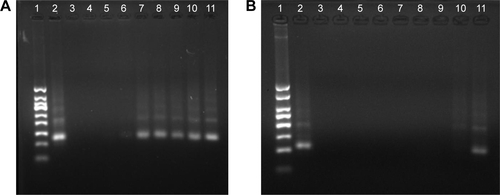
Figure S2 Cell inhibition by TM buffer on HT-29 cells.
Abbreviation: TM, 5 mM Tris and 5 mM MgCl2.
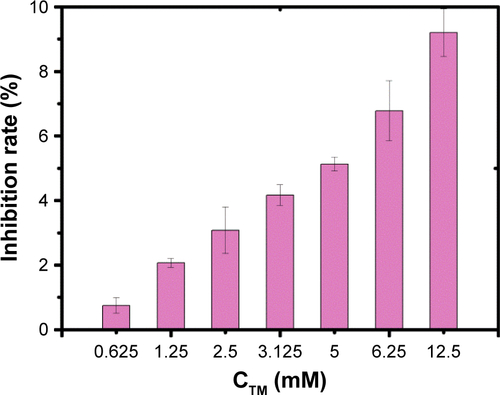
Figure S3 Intracellular uptake of DOX by HT-29 cells.
Abbreviations: DOX, doxorubicin; F, folic acid; S, aptamer SL2B.
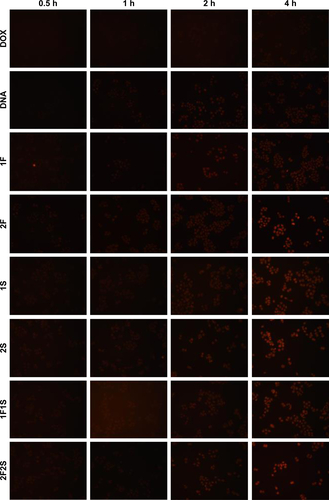
Table S1 Sequence of single strand DNA used in this work
Table S2 Cell inhibition by TD and TD-2F on HT-29 cells