Figures & data
Figure 1 Comparative mean in vitro cellulose acetate membrane transport profiles of piroxicam from formulations F2, F3 and reference gel.
Note: Mean ± S.D., N = 3.
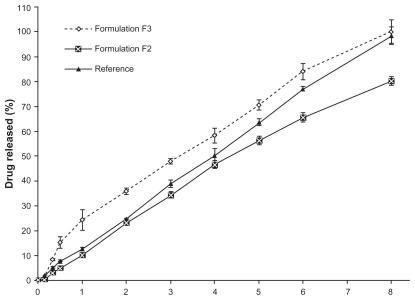
Table 1 Mean T50% drug transport across the cellulose acetate membrane from different formulations
Figure 2 Comparative mean in vitro rat skin permeation profiles of piroxicam from formulations F2, F3 and reference gel.
Note: Mean ± S.D., N = 3.
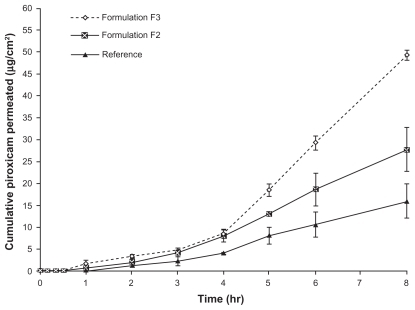
Table 2 Permeability parameters of the different formulations
Figure 3 The effect of topical administration of different formulations of piroxicam on rat hind paw edema at 2, 4 and 6 hours after administration of carrageenan.
Notes: *** and ** indicate significant at P < 0.001 and P < 0.01, respectively. Mean ± S.D., N = 6.
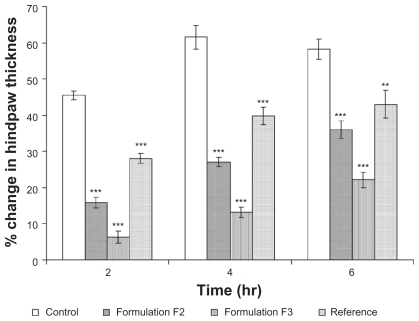
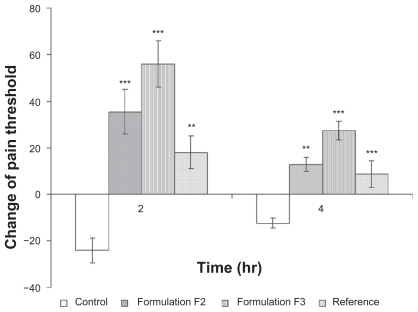
Figure 4 The effect of topical administration of different formulations of piroxicam on rat hind paw hyperalgesia at 2 and 4 hours after administration of carrageenan.
Notes: *** and ** indicate significant at P < 0.001 and P < 0.01, respectively. Mean ± S.D., N = 6.