Figures & data
Figure 1 (A) Schematic structures of as-grown single-wall carbon nanohorns (agSWCNHs) and oxidized single-wall carbon nanohorns (SWCNHox); (B) Pictures of agSWCNHs and SWCNHox suspensions in water without suspending agent and probe ultrasound; (C) Transmission electron microscope photographs of agSWCNHs and SWCNHox.
Note: Red arrows indicate the opened holes on top tubes.
Abbreviation: SWCNH, single-wall carbon nanohorn.
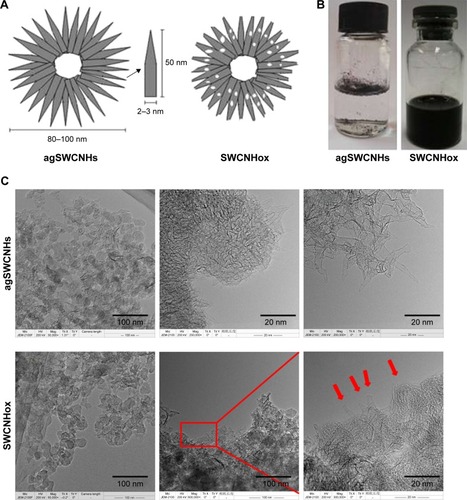
Table 1 The function and concentration of inhibitors used for endocytosis study
Figure 2 (A) Bright field graphs (40× magnification) of MDCK cells by high content imaging system. Cells were exposed to different concentrations of agSWCNHs and SWCNHox in DMEM containing 10% FBS at 37°C for 24 h; (B) SEM graphs of MDCK cells without any treatment, or incubated with 100 μg mL−1 agSWCNHs and SWCNHox suspensions at 37°C for 24 h, respectively. Arrows indicate the aggregations of agSWCNHs or SWCNHox; (C) The influence of agSWCNHs and SWCNHox on the viability of MDCK cells after 72 h treatment, measured by CCK-8 kit. Scale bars for images in are 5 μm.
Abbreviations: SWCNH, single-wall carbon nanohorn; MDCK, Madin-Darby canine kidney; FBS, fetal bovine serum; DMEM, Dulbecco’s Modified Eagle’s Medium; SEM, scanning electron microscope; CCK-8, Cell counting kit-8.
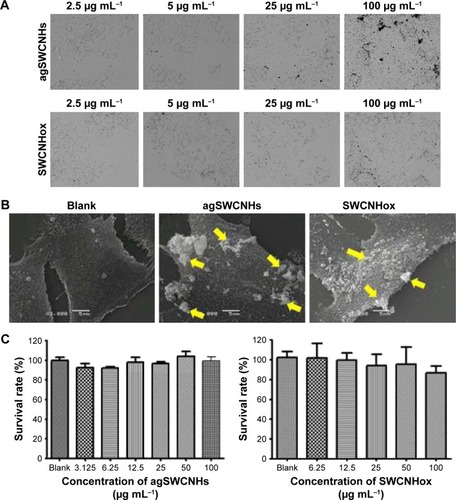
Figure 3 (A) CLSM images of digestive suspension MDCK cells after 24-h incubation with serum containing DMEM (control), supernatant of the FITC-BSA- conjugated SWCNHox (F-B-SWCNHox) suspension (supernatant control) or 20 μg mL−1 F-B-SWCNHox suspension; (B) The mean intracellular fluorescence intensity of control, supernatant and F-B-SWCNHox analyzed with Leica Qwin software. ***P<0.0001; (C) Digestive suspension MDCK cells exposed to serum containing DMEM, 20 μg mL−1 agSWCNHs or SWCNHox observed by CLSM with reflected light at 561 nm. Scale bars in the images are 25 μm; (D) The mean intracellular reflected light intensity of control, agSWCNHs and SWCNHox analyzed with Leica Qwin software. *P<0.05; **P<0.01; ***P<0.001; (E) Colocalization of lysosomes with control or 100 μg mL−1 agSWCNHs or SWCNHox, white arrows indicate the nanoparticles colocalized with lysosomes; (F) Quantitative colocalization analysis of agSWCNHs and SWCNHox with lysosomes using LAS AF software ***P<0.0001. Magenta presents the pseudo-color of reflected light of SWCNHs in C and E. Scale bars for images in A and C are 25 μm, scale bars for images in E are 5 μm.
Abbreviations: SWCNH, single-wall carbon nanohorn; agSWCNH, as-grown single-wall carbon nanohorns; SWCNHox, oxidized single-wall carbon nanohorns; CLSM, confocal laser scanning microscope; DMEM, Dulbecco’s Modified Eagle’s Medium; FITC, fluorescein isothiocyanate; FITC-BSA, FITC-conjugated bovine serum albumin.
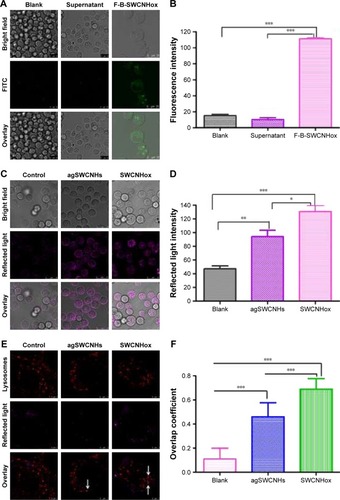
Figure 4 TEM graphs of MDCK cells incubated with 50 μg mL−1 agSWCNHs suspensions at 37°C for 24 h. Arrows indicate the internalized agSWCNHs. (A, B, D, E) Cytoplasmic vesicles full of agSWCNHs; (B, C, F) Internalized agSWCNHs clustered in large vesicular structures; (G, H), agSWCNHs in an endosomal vesicle; (I) agSWCNHs in lysosomes.
Abbreviations: TEM, transmission electron microscope; SWCNH, single-wall carbon nanohorn; MDCK, Madin-Darby canine kidney; agSWCNH, as-grown single-wall carbon nanohorns.
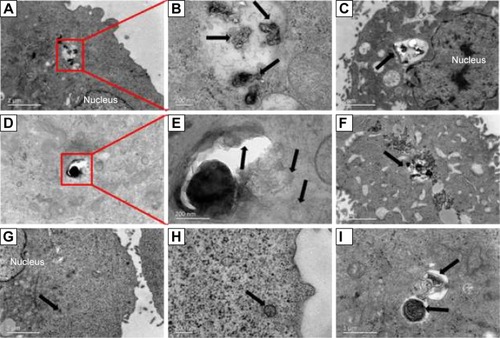
Figure 5 TEM graphs of MDCK cells incubated with 50 μg mL−1 SWCNHox suspension at 37°C for 24 h. Red rectangle and red lines indicate the enlarged area. Black arrows indicate the internalized SWCNHox. (A, B, D, E) Internalized SWCNHox clustered in an endosomal vesicle; (C) Single spherical SWCNHox was entering a cell; (F) SWCNHox in a lysosome; (G–I) SWCNHox in a multivesicular body.
Abbreviations: TEM, transmission electron microscope; SWCNHox, oxidized single-wall carbon nanohorns.
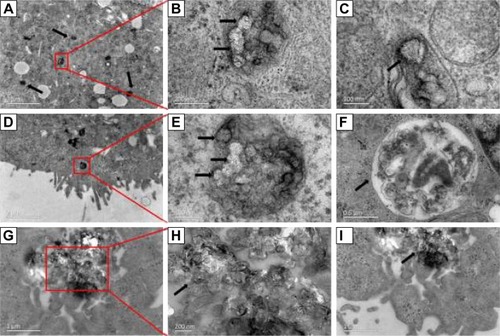
Figure 6 (A) Reflected light confocal microscope images of MDCK cells after incubation with 100 μg mL−1 agSWCNHs or SWCNHox at 4°C or 37°C for 4 h; (B) The mean intracellular reflected light intensity of MDCK cells exposed to 100 μg mL−1 agSWCNHs or SWCNHox at 4°C or 37°C for 4 h analyzed with Leica Qwin software. *P<0.05, **P<0.01; (C) The percentage of mean intracellular reflect light intensity of MDCK cells exposed to 100 μg mL−1 SWCNHox with different inhibitors analyzed with Leica Qwin software. ***P<0.001; (D) Reflected light confocal microscope images of MDCK cells pre-incubated with different inhibitors for 1 h, and continued incubation with 100 μg mL−1 SWCNHox together with different inhibitors for another 2 h. Magenta represented the pseudo-color of reflected light of SWCNHs. Scale bars for images in A and D are 25 μm.
Abbreviations: SWCNH, single-wall carbon nanohorn; MDCK, Madin-Darby canine kidney; MβCD, methyl β-cyclodextrin; agSWCNH, as-grown single-wall carbon nanohorns; SWCNHox, oxidized single-wall carbon nanohorns.
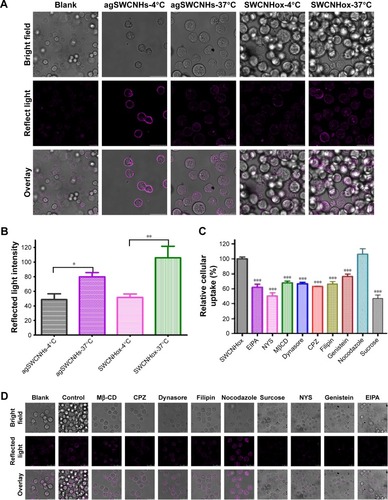
Figure 7 (A) The quantity of transported agSWCNHs, SWCNHox and F-B-SWCNHox across MDCK cell monolayer at a concentration of 20 μg mL−1; (B) The quantity of transported SWCNHox across MDCK cell monolayer with various concentrations; (C) The quantity of SWCNHox transported across MDCK cell monolayer at different time points; (D) Transported SWCNHox across MDCK cell monolayer after incubation with inhibibors for 2 h, all data were compared to the control group treated with SWCNHox alone. Statistical significance was analysed using ANOVA. *P<0.05, **P<0.01. At each time point in A–D, medium in the basolateral chamber was collected and measured with multifunctional microplate reader-optical density method.
Abbreviations: SWCNH, single-wall carbon nanohorn; F-B-SWCNHox, FITC-BSA conjugated SWCNHox; MDCK, Madin-Darby canine kidney; EIPA, 5-(N-ethyl-N-isopropyl)-amiloride; NYS, nystatin; MβCD, methyl β-cyclodextrin; CPZ, chlorpromazine.
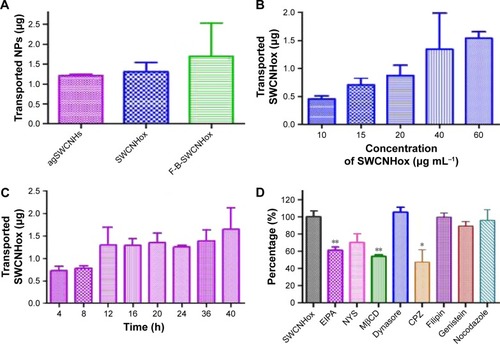
Figure 8 CLSM images of cell monolayer grown on Transwell in z-axis (A), in z-axis (B), and in y-axis (C) after incubation with 40 μg mL−1 F-B-SWCNHox suspensions at 37°C for 12 h. (D) Confocal image of the transported F-B-SWCNHox at excitation wavelength of 488 nm; (E, F) Three dimensional reconstructions of MDCK cell monolayer after incubation, observed by CLSM; arrows indicate the transcytosed F-B-SWCNHox. Green represents F-B-SWCNHox, blue represents nuclei, red represents lysosomes, and pink represents the pseudo-color of transwell membrane.
Abbreviations: CLSM, confocal laser scanning microscope; SWCNHox, oxidized single-wall carbon nanohorns; F-B-SWCNHox, FITC-BSA conjugated SWCNHox.
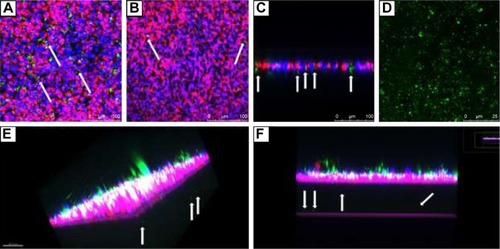
Figure 9 Uptake and transcytosis of SWCNHox in MDCK cell monolayers. Cells were exposed to 20 μg mL−1 SWCNHox in DMEM containing 10% FBS for 12 h, and cells without any treatment were used as control. Arrows indicate SWCNHox. (A) Control. (B) A cluster of SWCNHox was entering a cell. (C, D) Large numbers of SWCNHox accumulated into a multivesicular body (MVB) in cytoplasm. (E) SWCNHox in lysosomes. (F) A large cluster of SWCNHox was observed outside the cell and inside the filter pore. (G) A few SWCNHox were found between the MDCK monolayer and the filter. In the same image, SWCNHox was also observed in cell synapse growth in the filter hole. (H) SWCNHox adhesion on the filter.
Abbreviations: SWCNH, single-wall carbon nanohorn; SWCNHox, oxidized single-wall carbon nanohorns; DMEM, Dulbecco’s Modified Eagle’s Medium; FBS, fetal bovine serum; E, endosomes; MVB, multivesicularbodies; L, lysosomes.
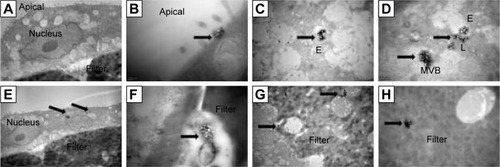
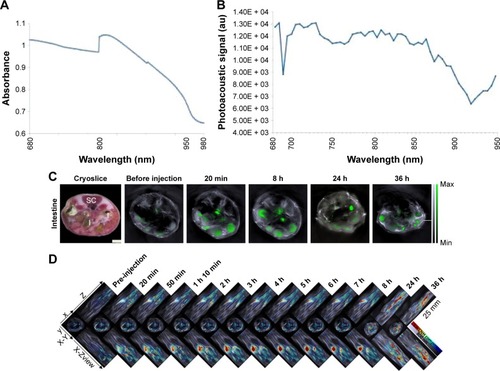
Figure 10 (A) Spectrometer spectrum of SWCNHox; (B) MSOT spectrum of SWCNHox; (C) Image of cryoslice was used as anatomical references: SC=spinal cord, I=intestines. Others depicted MSOT single cross-section images of the intestines, and showed the SWCNHox signal distribution in intestines at multiple time points after oral gavage of SWCNHox. MSOT images displayed a single-wavelength optoacoustic image (grayscale, 800 nm) as an anatomical reference with an overlay of multispectrally resolved SWCNHox signal (green). (D) Multiple intensity projections of 3D orthogonal views acquired with the MSOT at multiple time points. SWCNHox shown using a jet color scale superimposed over the grayscale 800 nm single wavelength images.
Abbreviations: MSOT, fast multispectral optoacoustic tomography; SWCNH, single-wall carbon nanohorn; SWCNHox, oxidized single-wall carbon nanohorns; 3D, three-dimensional.