Figures & data
Figure 1 Physicochemical characterization of synthesized Dex-SPIONs.
Notes: (A) TEM images of Dex-SPIONs. Magnification ×800,000; (B) hydrodynamic size of Dex-SPIONs; (C) ζ-potential of Dex-SPIONs in 1 mM KCl solution.
Abbreviations: Dex-SPIONs, dextran-coated superparamagnetic iron oxide nanoparticles; TEM, transmission electron microscopy.
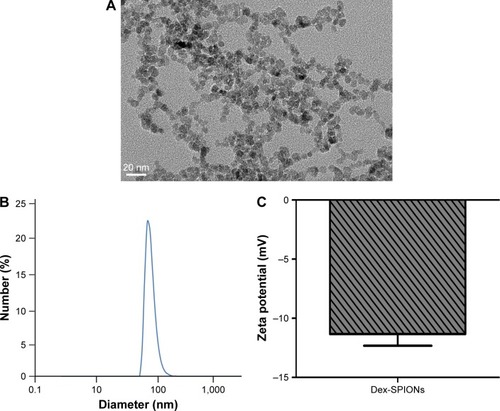
Figure 2 Cellular uptake of Dex-SPIONs and autophagy in human monocytes.
Notes: Human monocytes were treated with Dex-SPIONs (100 μg/mL) or not for 24 hours and processed for TEM analysis. (A) Untreated cells showing typical distribution of organelles. Magnification ×8,000. (B) Human monocytes treated with Dex-SPIONs showing multiple cytoplasmic vacuoles (black arrows). Detailed analysis of monocytes exposed to Dex-SPIONs revealed clear presence of the vacuoles. Magnification ×10,000. (C) An isolation membrane (white arrow) and a double-membranous phagophore developing into an autophagosome (black arrows). (D) Autophagosomes containing some organelles and electron-dense Dex-SPIONs (black arrows). (E) Dex-SPIONs were either in phagosomes (black arrows) or free in the cytoplasm (white arrows). (F) Some large vacuoles (black arrows) and multiple pseudopodia (white arrows) of the plasma membrane. (G) Concentration-dependent uptake of Dex-SPIONs, as measured by ferrozine assay. Magnification ×15,000. (n=3, **P<0.01) (H) Human monocytes were treated with Dex-SPIONs at 20 μg/mL or 100 μg/mL for 24 hours and then detected by flow cytometry.
Abbreviations: Dex-SPIONs, dextran-coated superparamagnetic iron oxide nanoparticles; TEM, transmission electron microscopy; FSC, forward scatter; SSC, side scatter.
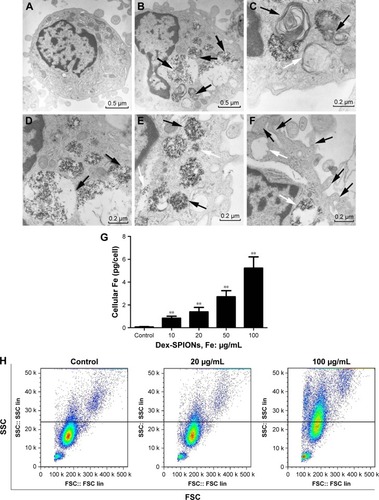
Figure 3 Dex-SPIONs induced autophagosome accumulation in human monocytes.
Notes: *P<0.05; **P<0.01; n=3. (A) Western blot analysis of LC3 in human monocytes after treatment with various concentrations (10–100 μg/mL) of Dex-SPIONs for 24 hours. (B) Western blot detected LC3 in human monocytes after treatment with Dex-SPIONs (100 μg/mL) at the times indicated. (C) Human monocytes treated or not with Dex-SPIONs (100 μg/mL) for 24 hours, stained with anti-LC3, DAPI (blue), and Alexa Fluor 568 goat antimouse IgG (red), then processed for confocal microscopy. CQ (30 μM) was used as a positive control. Quantitation of the percentage of cells with LC3+ puncta (white arrows). Scale bars 20 μm. Magnification ×60. (D) Western blot analysis of LC3 in human monocytes after treatment with various concentrations of dextran for 24 hours.
Abbreviations: Dex-SPIONs, dextran-coated superparamagnetic iron oxide nanoparticles; DAPI, 4′,6-diamidino-2-phenylindole; CQ, chloroquine.
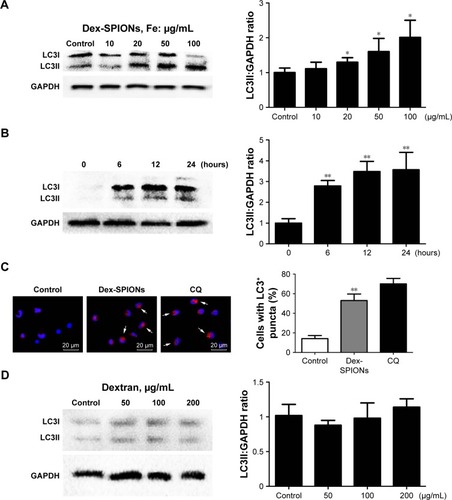
Figure 4 P62 was reduced by autophagy in Dex-SPION-treated human monocytes, and the autophagy was abrogated by autophagy inhibitors.
Notes: *P<0.05; **P<0.01; n=3. (A) Western blot analysis of p62 in human monocytes treated with various concentrations of Dex-SPIONs for 24 hours. (B) Western blot analysis of LC3 in human monocytes incubated with 100 μg/mL Dex-SPIONs for 24 hours. Wortmannin (50 nM) or CQ was added to the cells for 2 hours prior to Dex-SPION exposure. (C) Confocal microscopy analyzed the LC3 puncta of monocytes. Wortmannin or CQ was added to the cells for 2 hours prior to Dex-SPIONs (100 μg/mL) exposure. Scale bars 10 μm. Magnification ×100. (D) Quantitation of percentage of cells with LC3+ puncta (white arrows).
Abbreviations: Dex-SPIONs, dextran coated superparamagnetic iron oxide nanoparticles; CQ, chloroquine.
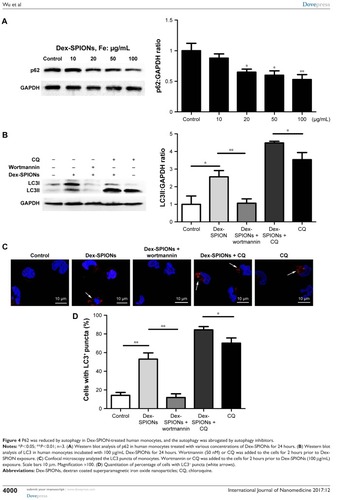
Figure 5 Short-term cytotoxicity of Dex-SPIONs to human monocytes.
Notes: *P<0.05; **P<0.01; n=3. (A) Human monocytes were observed by phase-contrast microscopy after 24 hours. Scale bars 50 μm. Magnification ×20. (B, C) Viability of human monocytes treated with Dex-SPIONs (10–100 μg/mL) for 24 or 48 hours. (D) Cell viability was analyzed by CCK-8 and LC3 measured at 48 hours. Wortmannin (50 nM) was added to the cells for 2 hours prior to Dex-SPION treatment.
Abbreviations: CCK-8, cell counting kit; Dex-SPIONs, dextran coated superparamagnetic iron oxide nanoparticles.
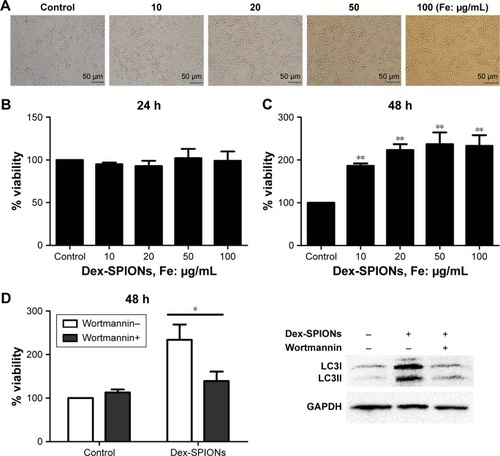
Figure 6 Dex-SPIONs induced inflammation of human monocytes.
Notes: **P<0.01; n=3. Cells were treated with or without Dex-SPIONs (10–100 μg/mL) for 24 hours. (A) TNFα levels; (B) IL1β levels; (C) IL6 levels.
Abbreviation: Dex-SPIONs, dextran coated superparamagnetic iron oxide nanoparticles.
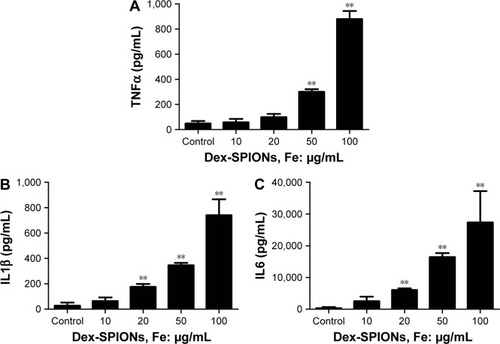
Figure 7 Inhibition of autophagy enhanced inflammation of human monocytes.
Notes: **P<0.01; n=3. Cells were treated with Dex-SPIONs (100 μg/mL) for 24 hours. Wortmannin (50 nM) was added to the cells for 2 hours prior to Dex-SPION treatment. (A) TNFα levels; (B) IL1β levels; (C) IL6 levels. (D) LC3 measured at 24 hours.
Abbreviation: Dex-SPIONs, dextran coated superparamagnetic iron oxide nanoparticles.
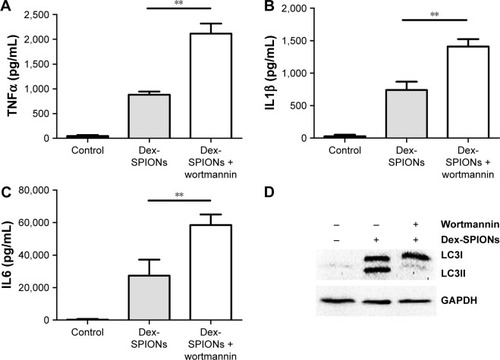
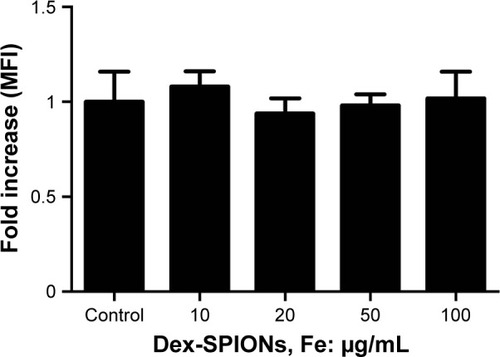
Figure 8 Effect of Dex-SPIONs on phagocytosis of human monocytes.
Notes: Human monocytes were treated with Dex-SPIONs (10–100 μg/mL) for 24 hours. Immediately, the MFI of cells was measured by Multiskan Spectrum (n=3).
Abbreviations: Dex-SPIONs, dextran coated superparamagnetic iron oxide nanoparticles; MFI, mean fluorescence intensity.