Figures & data
Figure 1 Nanoparticles of diamond, silver, gold, and platinum.
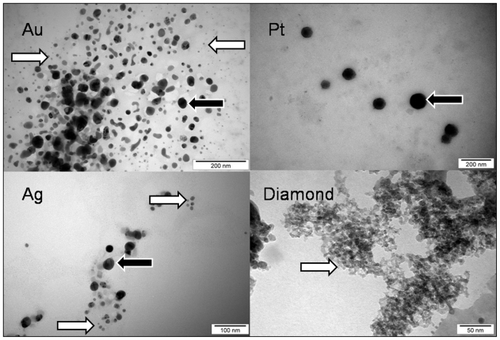
Figure 2 Staphylococcus aureus and Candida albicans. None of the toxicologic or destructive effects of the procedure can be seen.
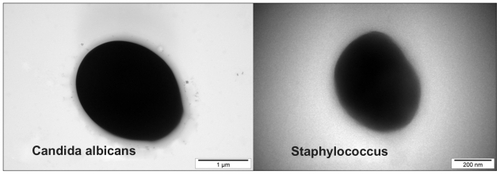
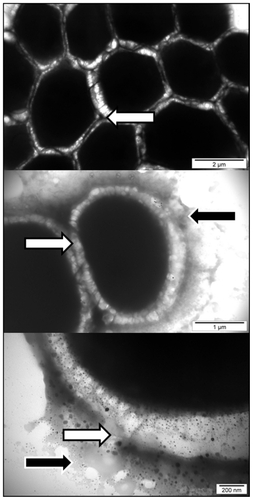
Figure 3 Interaction between Staphylococcus aureus and diamond nanoparticles. Arrows indicate nanoparticles nonspecifically attached to the microorganisms.
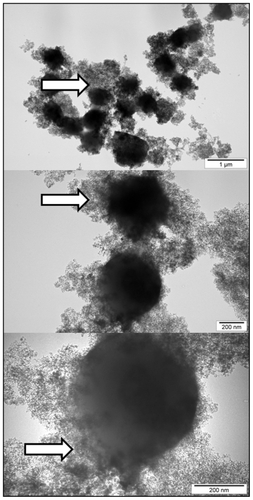
Figure 4 Interaction between Candida albicans and diamond nanoparticles. Arrows indicate nanoparticles surrounding cells very closely.
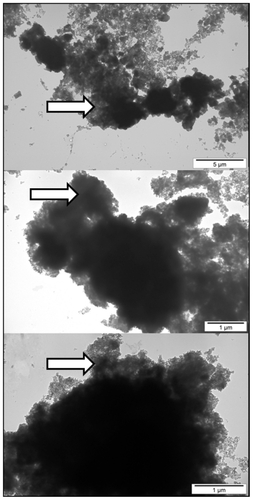
Figure 5 Interaction between Staphylococcus aureus and silver nanoparticles. Arrows indicate nanoparticles located at specific points on the cells, attached to the substance released by microorganisms.
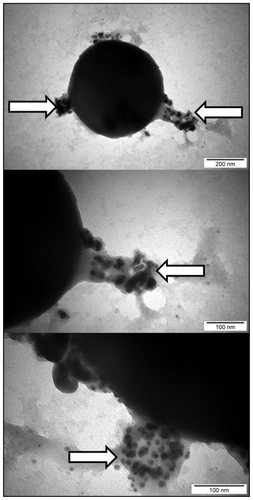
Figure 6 Interaction between Candida albicans and silver nanoparticles. White arrows indicate nanoparticles attached to the substance released by microorganisms. Black arrows indicate distorted cells, a disintegrated cell wall, and cytoplasmac membrane.
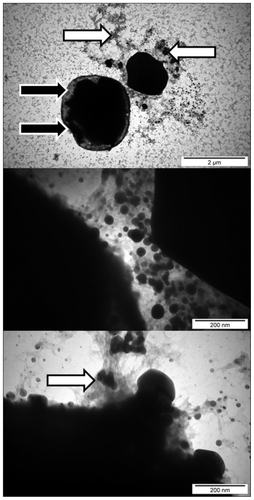
Figure 7 Interaction between Staphylococcus aureus and gold nanoparticles. White arrows indicate nanoparticles trapped by the biofilm and the substance released by cells. Black arrow indicates distorted cell wall.
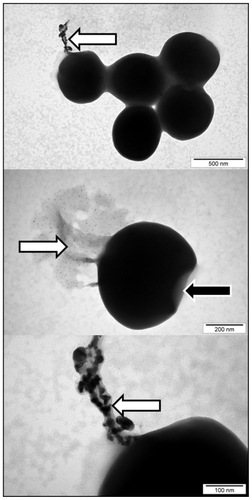
Figure 8 Interaction between Candida albicans and gold nanoparticles. Arrows indicate the substance of different electron density released by cells.
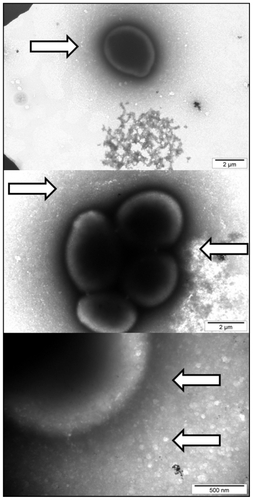
Figure 9 Interaction between Staphylococcus aureus and platinum nanoparticles. Arrows indicate nanoparticles and the substance released by cells.
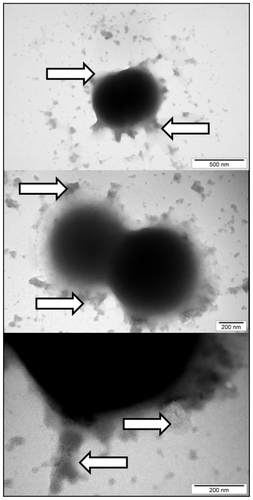
Figure 10 Interaction between Candida albicans and platinum nanoparticles. Black arrows indicate nanoparticles surrounded by the released substance. White arrows indicate the cell wall loosened and separated from the membrane or disrupted.