Figures & data
Figure 1 Molecular structure of oridonin.
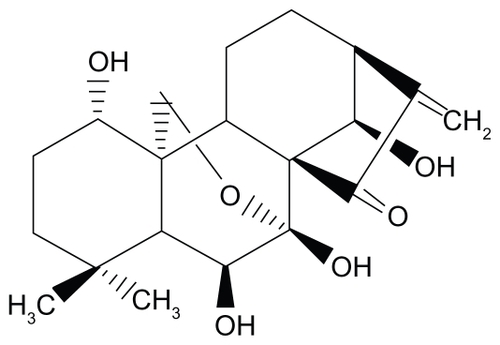
Figure 2 MTT assay showing that the treatment of ORI nanosuspension and free ORI solution inhibit growth of PC-3 cells in a time- and dose-dependent manner. Results are expressed as mean ± standard deviation (n = 6).
Notes: *P < 0.05, **P < 0.01, ***P < 0.005 versus the same dose of free ORI solution group.
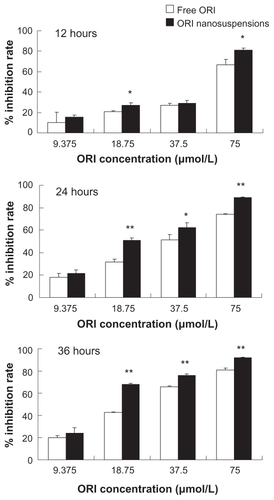
Table 1 The IC50 values (μmol/L) of oridonin (ORI) nanosuspension and ORI solution on PC-3 cells (n = 6)
Figure 3 The effect of oridonin nanosuspension on apoptosis morphological change of PC-3 cells (X200).
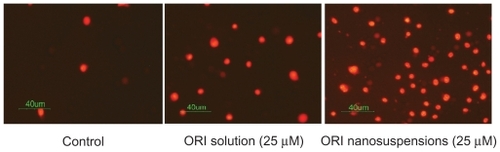
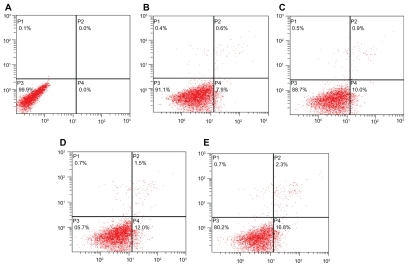
Figure 4 The effect of oridonin nanosuspension on the proliferation cycle of PC-3 cells. A) Control. B) 25 μmol/L ORI solution. C) 25 μmol/L ORI nanosuspension. D) 50 μmol/L ORI solution. E) 50 μmol/L ORI nanosuspension.
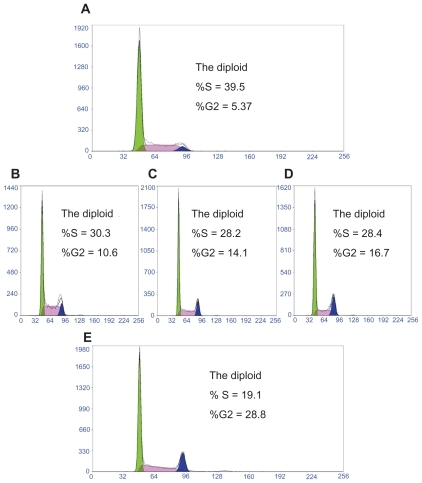
Figure 5 The effect of oridonin nanosuspension on early apoptosis ratio of PC-3 cells (n = 3).
Notes: *P < 0.05, **P < 0.01, ***P < 0.005 versus the same dose of free ORI solution group.
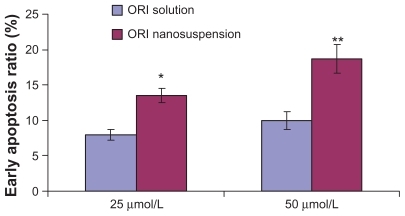
Figure 6 The effect of oridonin nanosuspensions on early apoptosis of PC-3 cells. A) Control. B) 25 μmol/L ORI solution. C) 50 μmol/L ORI solution. D) 25 μmol/L ORI nanosuspension. E) 50 μmol/L ORI nanosuspension.