Figures & data
Table 1 Lip-ABC and Lip-PBS formulation characteristics
Figure 1 Characterization of Lip-ABC or Lip-PBS.
Notes: (A) Lip-ABC diameter distribution. (B) Lip-PBS diameter distribution. (C) Lip-ABC zeta potential. (D) Lip-PBS zeta potential.
Abbreviations: Lip-ABC, liposomes containing ammonium bicarbonate; Lip-PBS, liposomes containing phosphate-buffered saline.
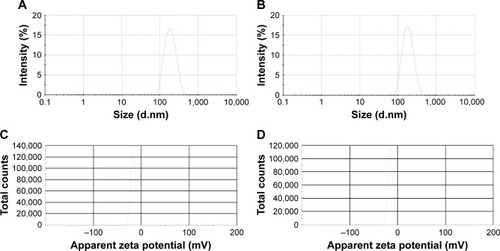
Table 2 Lip-ABC and Lip-PBS diameters after HIFU intervention
Figure 2 Ultrasound imaging of Lip-ABC or Lip-PBS under different temperature.
Notes: (A–C) Ultrasound imaging of Lip-ABC at 37°C, 42°C, and 50°C. (D–F) Ultrasound imaging of Lip-PBS at 37°C, 42°C, and 50°C.
Abbreviations: Lip-ABC, liposomes containing ammonium bicarbonate; Lip-PBS, liposomes containing phosphate-buffered saline.
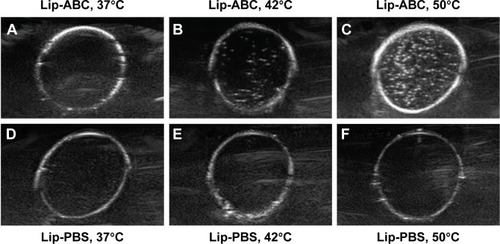
Figure 3 Ultrasound monitoring of Lip-ABC or Lip-PBS after HIFU triggering with different powers.
Notes: (A–D) Ultrasound monitoring of Lip-ABC after HIFU triggering (60, 90, 120, and 150 w). (E–H) Ultrasound monitoring of Lip-PBS after HIFU triggering (60, 90, 120, and 150 w). (I) Average gray-scale difference of each group after HIFU triggering. (J) Schematic illustration of HIFU triggering Lip-ABC to generate CO2 bubbles. Arrows represented sequential occurrencing. *P<0.05, **P<0.01.
Abbreviations: Lip-ABC, liposomes containing ammonium bicarbonate; HIFU, high-intensity focused ultrasound; Lip-PBS, liposomes containing phosphate-buffered saline.
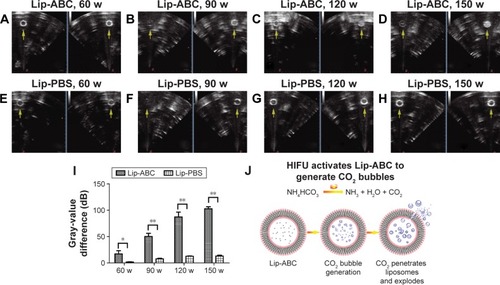
Figure 4 Diameter distribution of Lip-ABC or Lip-PBS after HIFU Intervention.
Notes: (A) Lip-ABC diameter distribution after HIFU intervention. (B) Lip-PBS diameter distribution after HIFU intervention.
Abbreviations: Lip-ABC, liposomes containing ammonium bicarbonate; HIFU, high-intensity focused ultrasound; Lip-PBS, liposomes containing phosphate-buffered saline.
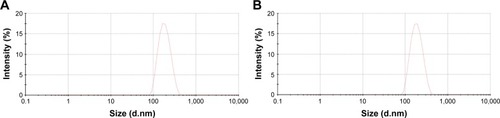
Figure 5 Lip-ABC or Lip-PBS synergizes HIFU ablation in vitro.
Notes: (A–C) Ultrasound monitoring of HIFU ablation to bovine liver. (D–F) Macroscopic views of coagulative necrosis in bovine liver of the Lip-ABC, Lip-PBS, and PBS groups. (G) Average gray-scale differences. (H) Gray-scale change areas. (I) Coagulative necrosis volume of every group. (J–L) HE staining of coagulative necrosis in bovine livers of the Lip-ABC, Lip-PBS, and PBS groups respectively (20×10). The red arrowhead showed the area where the gray scale changed and the blue arrow represented the coagulation necrotic area. **P<0.01.
Abbreviations: HIFU, high-intensity focused ultrasound; Lip-ABC, liposomes containing ammonium bicarbonate; Lip-PBS, liposomes containing phosphate-buffered saline; HE, hematoxylin–eosin; ns, no significant difference.
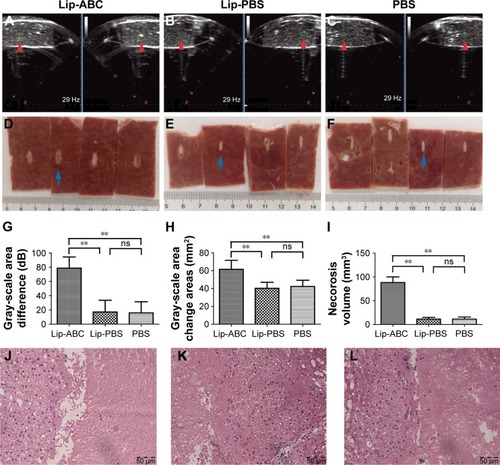
Figure 6 Schematic illustration of HIFU tumor ablation and Lip-ABC synergizing HIFU tumor ablation.
Notes: (A) Schematic illustration of HIFU tumor ablation. (B) Schematic illustration of Lip-ABC synergizing HIFU tumor ablation.
Abbreviations: HIFU, high-intensity focused ultrasound; Lip-ABC, liposomes containing ammonium bicarbonate.
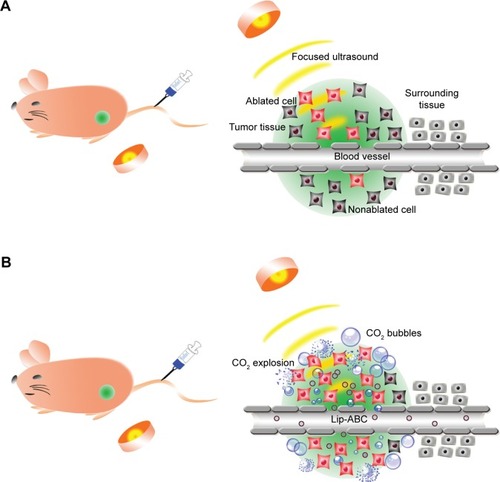
Figure 7 Photoacoustic imaging of tumors at different time points after injecting Lip-ABC or Lip-PBS.
Notes: (A) Animal tumor model. (B–E) Photoacoustic imaging of tumors at 0, 2, 4, and 6 h after injecting Lip-ABC by IOCV. (F–I) Photoacoustic imaging of tumors at 0, 2, 4, and 6 h after injecting Lip-PBS by IOCV. (J) The photoacoustic intensity of each group changed with time.
Abbreviations: Lip-ABC, liposomes containing ammonium bicarbonate; Lip-PBS, liposomes containing phosphate-buffered saline; h, hour; PA, photoacoustic imaging; IOCV, injection into caudual vein.
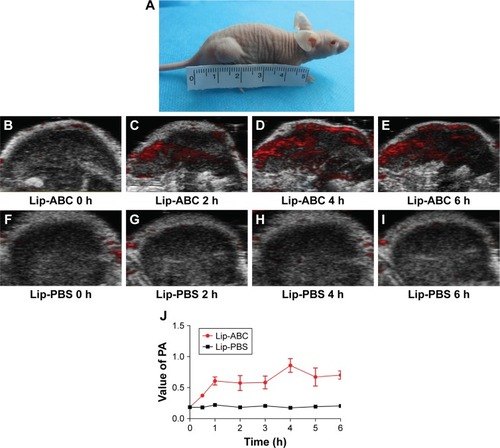
Figure 8 Lip-ABC or Lip-PBS synergizing HIFU ablation in vivo.
Notes: (A and B) Ultrasound monitoring of HIFU tumor ablation in the Lip-ABC and Lip-PBS groups. (C and D) Macroscopic views of coagulative necrosis in tumors in the Lip-ABC and Lip-PBS groups 1 h after HIFU. (E and F) After 3 d. (G and H) After 7 d. (I) Average gray-scale differences. (J) Gray-scale change areas. (K) Coagulative necrosis volumes in tumors. The red arrowhead showed the area where the gray scale changed and the blue arrow represented the coagulation necrotic area. *P<0.05, **P<0.01.
Abbreviations: HIFU, high-intensity focused ultrasound; Lip-ABC, liposomes containing ammonium bicarbonate; Lip-PBS, liposomes containing phosphate-buffered saline; h, hour; d, day.
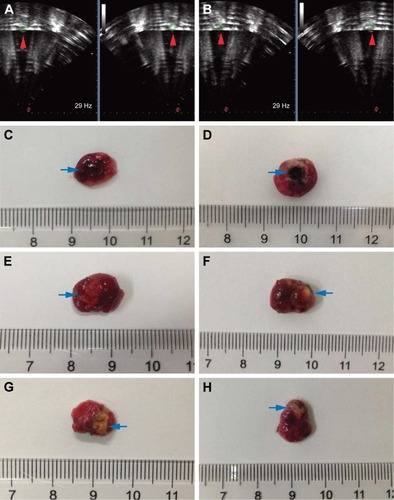
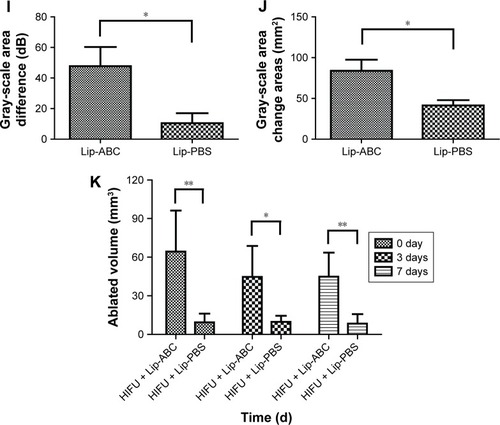
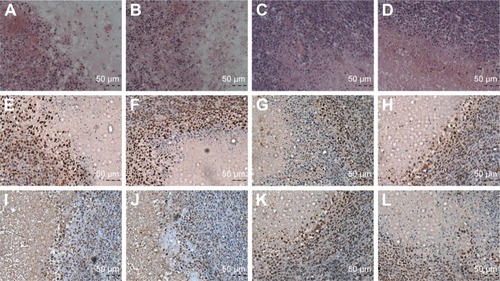
Figure 9 HE staining, apoptosis and PCNA expression of coagulative necrosis in every group.
Notes: (A and B) HE staining of coagulative necrosis in tumors in the Lip-ABC group after 3 and 7 d (20×10). (C and D) HE staining in the Lip-PBS group after 3 and 7 d (20×10). (E and F) Apoptosis of coagulative necrosis in tumors of the Lip-ABC group after 3 and 7 d (20×10). (G and H) Apoptosis in the Lip-PBS group after 3 and 7 d (20×10). (I and J) PCNA expression of coagulative necrosis in Lip-ABC group tumors after 3 and 7 d (20×10). (K and L) PCNA expression in the Lip-PBS group after 3 and 7 d (20×10).
Abbreviations: HE, hematoxylin–eosin; Lip-ABC, liposomes containing ammonium bicarbonate; d, day; Lip-PBS, liposomes containing phosphate-buffered saline; PCNA, proliferating cell nuclear antigen.