Figures & data
Table 1 Primers used for qRT-PCR for the analysis of expression of proapoptotic and antiapoptotic genes
Figure 1 Synthesis and characterization of AgNPs using resveratrol.
Notes: (A) The absorption spectrum of AgNPs synthesized using resveratrol. (B) X-ray diffraction spectra of AgNPs. (C) Fourier transform infrared spectra of AgNPs. (D) Size distribution of AgNPs measured by dynamic light scattering. (E) TEM images of AgNPs. (F) Several fields were used to measure the particle size of AgNPs; micrograph shows size distributions based on TEM images of AgNPs ranging from 3 to 20 nm.
Abbreviations: AgNPs, silver nanoparticles; TEM, transmission electron microscopy.
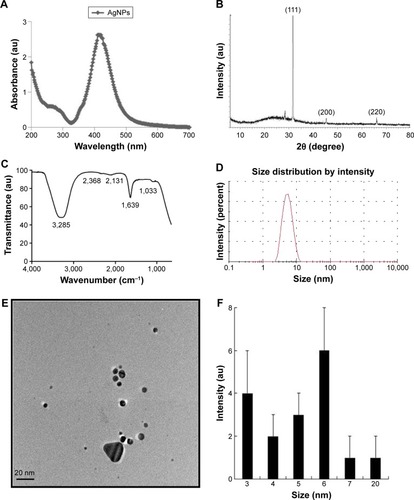
Table 2 Characteristics of AgNPs and AgNPs containing GEM (means, n=3)
Figure 2 Dose-dependent effect of GEM and AgNPs on cell viability in human ovarian cancer cells.
Notes: (A) A2780 human ovarian cancer cells were incubated with various concentrations of GEM (25–200 nM) for 24 h, and cell viability was measured using WST-8. (B) A2780 were incubated with various concentrations of AgNPs (25–200 nM) for 24 h, and cell viability was measured using WST-8. The results are expressed as the mean ± standard deviation of three separate experiments. Differences between the treated and control groups were measured using Student’s t-test. Statistically significant differences between the treated and control group are indicated by (*P<0.05).
Abbreviations: AgNP, silver nanoparticle; GEM, gemcitabine.
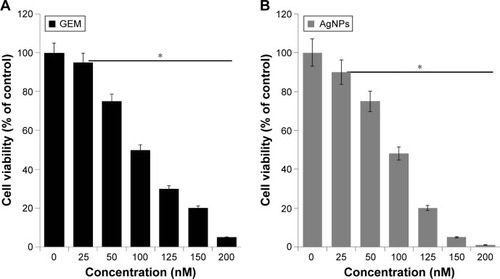
Figure 3 The effect of combined treatment with GEM and AgNPs on cell viability in human ovarian cancer cells.
Notes: (A) A2780 were incubated with GEM (50 nM) and AgNPs (50 nM). (B) A2780 cells were incubated with a combination of different concentrations of AgNPs (50 and 100 nM) and a fixed concentration of GEM (50 nM) for 24 h. The results are expressed as the mean ± standard deviation of three separate experiments. Differences between the treated and control groups were measured using Student’s t-test. Statistically significant differences between the treated and control group are indicated by (*P<0.05).
Abbreviations: AgNP, silver nanoparticle; Con, control; GEM, gemcitabine.
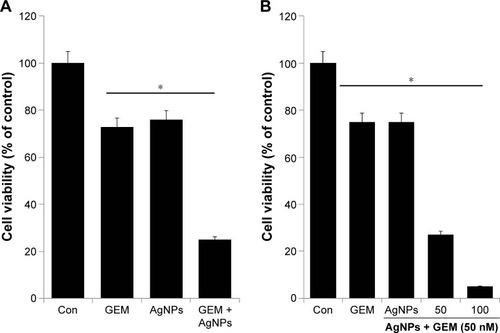
Figure 4 The effect of single treatment with GEM or AgNPs, or the combination of GEM and AgNPs, on cell morphology of human ovarian cancer cells.
Notes: The human ovarian cancer cells were incubated with GEM (50 nM), AgNPs (50 nM), or the combination of GEM (50 nM) and AgNPs (50 nM), for 24 h. Treated cells were imaged under a light microscope (200 μm). Red parentheses indicate cell shrinkage and fragmentation.
Abbreviations: AgNP, silver nanoparticle; Con, control; GEM, gemcitabine.
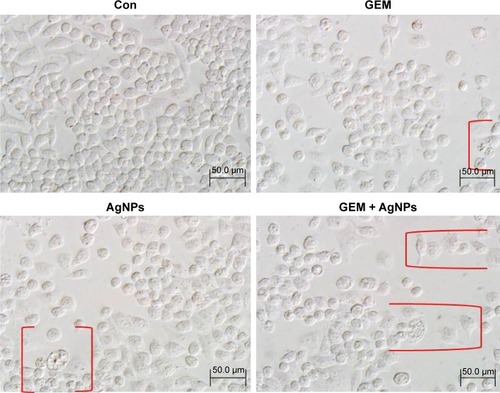
Figure 5 The effect of combined treatment with GEM and AgNPs on proliferation of human ovarian cancer cells.
Notes: (A) The effect on cell proliferation was observed by measuring the incorporation of BrdU after a 24-h incubation with GEM (50 nM), AgNPs (50 nM), or a combination of GEM (50 nM) and AgNPs (50 nM). (B) The effect on cell proliferation was observed using the trypan blue exclusion assay after a 24-h incubation with GEM (50 nM), AgNPs (50 nM), or a combination of GEM (50 nM) and AgNPs (50 nM). The results are expressed as the mean ± standard deviation of three independent experiments. Differences between the treated and control groups were measured using Student’s t-test. Statistically significant differences between the treated and control group are indicated by (*P<0.05).
Abbreviations: AgNP, silver nanopaeticle; Con, control; GEM, gemcitabine.
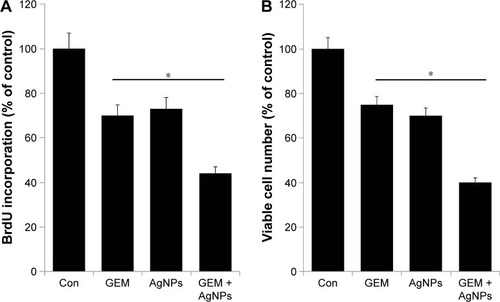
Figure 6 The cytotoxicity of GEM, AgNPs, or combined treatment with GEM and AgNPs in human ovarian cancer cells.
Notes: (A) A2780 cells were treated with GEM (50 nM), AgNPs (50 nM), or a combination of GEM (50 nM) and AgNPs (50 nM) for 24 h. The activity of LDH was measured at 490 nm using the LDH cytotoxicity kit. (B) The level of dead-cell protease was determined by CytoTox-Glo cytotoxicity assay. The results are expressed as the mean ± standard deviation of three independent experiments. Differences between the treated and control groups were measured using Student’s t-test. Statistically significant differences between the treated and control group are indicated by (*P<0.05).
Abbreviations: AgNP, silver nanopaeticle; Con, control; GEM, gemcitabine; LDH, lactate dehydrogenase.
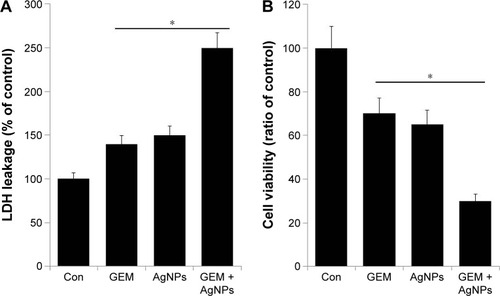
Figure 7 The effect of GEM, AgNPs, or a combination of GEM and AgNPs on oxidative stress in human ovarian cancer cells.
Notes: (A) The levels of ROS were assessed by measuring the relative fluorescence of 2′,7′-dichlorofluorescein using a spectrofluorometer. (B) Cells were treated with GEM (50 nM), AgNPs (50 nM), or the combination of GEM (50 nM) and AgNPs (50 nM) for 24 h; MMP (measured as a ratio of JC-1 aggregate to monomer) was determined after the treatments. The results are expressed as the mean ± standard deviation of three independent experiments. Differences between the treated and control groups were measured using Student’s t-test. Statistically significant differences between the treated and control group are indicated by (*P<0.05).
Abbreviations: AgNP, silver nanoparticle; Con, control; GEM, gemcitabine; MMP, mitochondrial membrane potential; NAC, N-acetyl cysteine; ROS, reactive oxygen species.
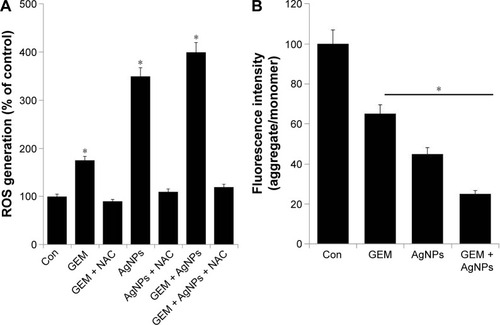
Figure 8 The effect of combined treatment with GEM and AgNPs on the expression of proapoptotic and antiapoptotic genes.
Notes: Relative mRNA expression was analyzed using qRT-PCR in human ovarian cancer cells after treatment with GEM (50 nM), AgNPs (50 nM), or a combination of GEM (50 nM) and AgNPs (50 nM), for 24 h. The results are expressed as the mean ± standard deviation of three separate experiments. Differences between the treated and control groups were measured using Student’s t-test. Statistically significant differences between the treated and control group are indicated by (*P<0.05).
Abbreviations: AgNP, silver nanoparticle; Con, control; GEM, gemcitabine; qRT-PCR, quantitative reverse transcriptase polymerase chain reaction.
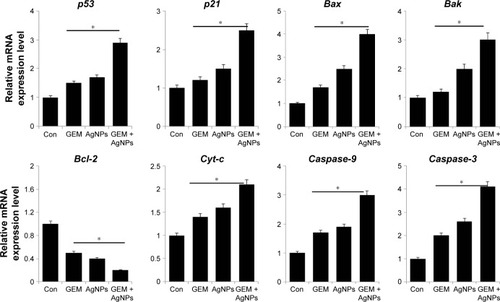
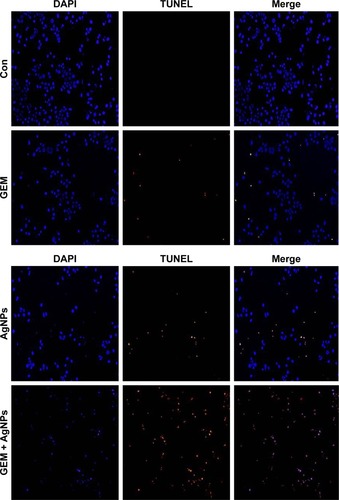
Figure 9 The effect of treatment with GEM, AgNPs, or a combination of GEM and AgNPs, on apoptosis in human ovarian cancer cells.
Notes: The cells were treated with GEM (50 nM), AgNPs (50 nM), or a combination of GEM (50 nM) and AgNPs (50 nM), for 24 h. Apoptosis in human ovarian cancer cells after a 24-h treatment was assessed using the TUNEL assay; the nuclei were counterstained with DAPI. Representative images show apoptotic (fragmented) DNA (red staining) and the corresponding cell nuclei (blue staining).
Abbreviations: AgNP, silver nanoparticle; Con, control; GEM, gemcitabine.