
Figures & data
Figure 1 Detection of binding between NBs and A10-3.2 aptamer using LCSM and FCM.
Notes: (A) DiI-labeled NBs showing red fluorescence. (B) FAM-labeled A10-3.2 aptamer showing green fluorescence. (C) Overlap of the A10-3.2 aptamer with NBs appearing as yellow fluorescence in the combined channel. (D) PTX-PLGA NBs. (E) PTX-A10-3.2-PLGA NBs. (F) Average binding efficiencies of different NBs.
Abbreviations: DiI, 1,1′-dioctadecyl-3,3,3′,3′-tetramethylindocarbocyanine perchlorate; FAM, carboxyfluorescein; FCM, flow cytometry; LCSM, laser confocal scanning microscopy; NBs, nanobubbles; PLGA, poly(lactide-co-glycolic acid); PTX, paclitaxel.
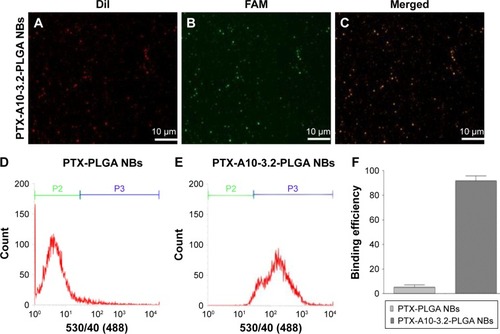
Table 1 Characterization of the different formulations of NBs
Figure 2 Characterization of NBs.
Notes: (A1–A3) Optical microscopy images of different formulations of NBs. (B1–B3) SEM (×20,000) images of different formulations of NBs. (C1–C3) TEM images of different formulations of NBs.
Abbreviations: NBs, nanobubbles; PLGA, poly(lactide-co-glycolic acid); PTX, paclitaxel; SEM, scanning electron microscopy; TEM, transmission electron microscopy.
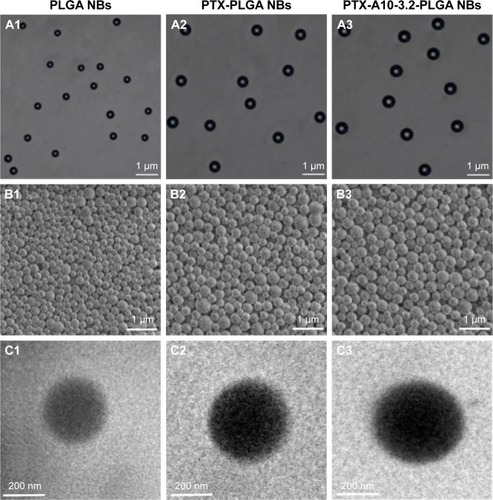
Figure 3 In vitro drug release profiles.
Notes: (A) In vitro drug release profiles of PTX-A10-3.2-PLGA NBs and PTX-A10-3.2-PLGA NBs + US for 1–30 days. (B) In vitro drug release profiles of PTX-A10-3.2-PLGA NBs and PTX-A10-3.2-PLGA NBs + US for 1–5 days.
Abbreviations: NBs, nanobubbles; PLGA, poly(lactide-co-glycolic acid); PTX, paclitaxel; US, ultrasound.
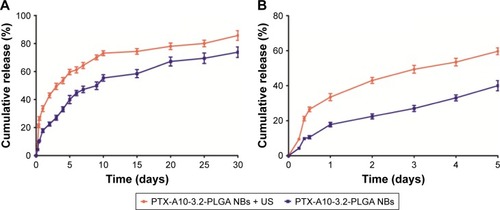
Figure 4 Detection of binding between different formulations of NBs and two types of cells using direct fluorescence imaging and FCM.
Notes: (A) PTX-A10-3.2-PLGA NBs + US and LNCaP cells. (B) PTX-A10-3.2-PLGA NBs and LNCaP cells. (C) PTX-A10-3.2-PLGA NBs + A10-3.2 and LNCaP cells. (D) PTX-PLGA NBs and LNCaP cells. (E) PTX-A10-3.2-PLGA NBs and PC3 cells. (F) Histogram of the binding efficiency between different formulations of NBs and the two types of cells. Blue (DAPI) indicates cell nuclei, green (DiO) indicates the cytomembrane, and red (DiI) dots indicate DiI-labeled NBs.
Abbreviations: DAPI, 4′,6-diamidino-2-phenylindole; DiI, 1,1′-dioctadecyl-3,3,3′,3′-tetramethylindocarbocyanine perchlorate; DiO, 3,3′-dioctadecyloxacarbocyanine perchlorate; FCM, flow cytometry; NBs, nanobubbles; PLGA, poly(lactide-co-glycolic acid); PTX, paclitaxel; US, ultrasound.
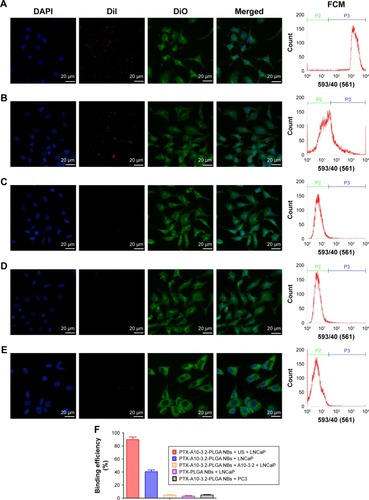
Figure 5 In vitro cell viability.
Notes: (A) Effect of different formulations of NBs on the viability of LNCaP cells for 48 h. PTX-A10-3.2-PLGA NBs compared with the other three groups, #P<0.05, ##P<0.01; PTX-PLGA NBs compared with the other three groups, **P<0.01. (B) Effect of different PTX-loaded formulations on the viability of LNCaP cells for 48 h. PTX-A10-3.2-PLGA NBs + US compared with the other three groups, #P<0.05, ##P<0.01; PTX compared with the other three groups, **P<0.01; PTX-PLGA NBs compared with PTX-A10-3.2-PLGA NBs, ▲P<0.05, ▲▲P<0.01. (C) Cell viability of LNCaP cells incubated with PTX-A10-3.2-PLGA NBs at different concentrations of PTX with or without ultrasonic irradiation for 48 h. PC3 cells were used as controls. PTX-A10-3.2-PLGA NBs + US + LNCaP cells compared with the other three groups, #P<0.05, ##P<0.01; PTX-A10-3.2-PLGA NBs + PC3 cells compared with the other three groups, **P<0.01; PTX-A10-3.2-PLGA NBs + LNCaP cells compared with PTX-A10-3.2-PLGA NBs + US + PC3 cells groups, ▲▲P<0.01.
Abbreviations: NBs, nanobubbles; PLGA, poly(lactide-co-glycolic acid); PTX, paclitaxel; US, ultrasound.
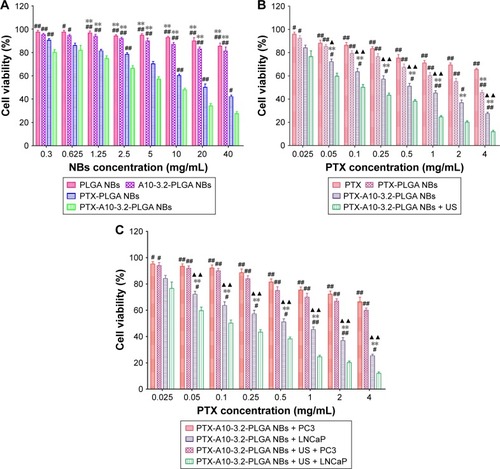
Figure 6 Cell apoptosis is detected by FCM in various groups.
Notes: (A and C) 24 h; (B and D) 48 h: control, PTX, PTX-PLGA NBs, PTX-A10-3.2-PLGA NBs and PTX-A10-3.2-PLGA NBs + US. Data are mean ± SD (n=3). Control compared with other groups, *P<0.05, **P<0.01; PTX-A10-3.2-PLGA NBs + US compared with other groups, #P<0.05, ##P<0.01; PTX-PLGA NBs compared with PTX and PTX-A10-3.2-PLGA NBs, ▲P<0.05, ▲▲P<0.01; PTX compared with PTX-A10-3.2-PLGA NBs, □P<0.05, □□P<0.01.
Abbreviations: EA, early apoptosis; FCM, flow cytometry; LA, late apoptosis; NBs, nanobubbles; PLGA, poly(lactide-co-glycolic acid); PTX, paclitaxel; TA, total apoptosis; US, ultrasound.
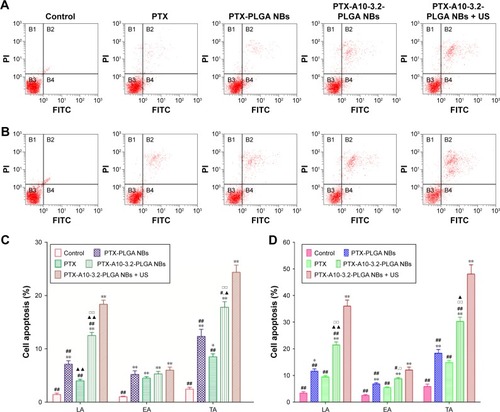
Figure 7 NBs in US imaging in vitro.
Notes: (A) Samples with different concentrations of PTX-A10-3.2-PLGA NBs (2.5, 5, 10, 20, and 40 mg/mL), Brightness mode and contrast mode. (B) Relationship between the mean gray value and the concentration. The deionized water group compared with other groups, *P<0.05; PTX-A10-3.2-PLGA NBs (40 mg/mL) group compared with the other groups, #P<0.05.
Abbreviations: NBs, nanobubbles; PLGA, poly(lactide-co-glycolic acid); PTX, paclitaxel; US, ultrasound.
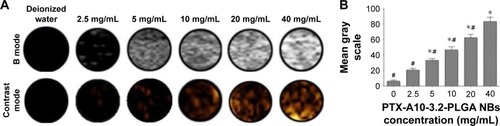
Figure 8 High-frequency resolution US imaging under contrast mode for PTX-PLGA NBs and PTX-A10-3.2-PLGA NBs in xenograft tumors.
Notes: (A) Tumor-targeted real-time US imaging in contrast mode (the enhancement is shown in green) in various groups: the normal saline group, PTX-PLGA NBs group, and PTX-A10-3.2-PLGA NBs group. (B) GSI in various groups. Control compared with the other groups, *P<0.05; PTX-A10-3.2-PLGA NBs compared with the other groups, #P<0.05.
Abbreviations: GSI, gray-scale intensity; NBs, nanobubbles; PLGA, poly(lactide-co-glycolic acid); PTX, paclitaxel; US, ultrasound.
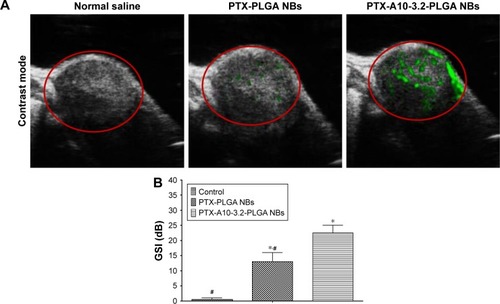
Figure 9 Changes in the fluorescence intensity of DiR-labeled PTX-PLGA NBs and PTX-A10-3.2-PLGA NBs in xenograft tumors at the time intervals of 0, 2, 4, 8, 12, and 24 h.
Note: Red circles indicate the areas of xenograft tumors.
Abbreviations: DiR, 1,1′-dioctadecyl-3,3,3′,3′-tetramethylindotricarbocyanine; NBs, nanobubbles; PLGA, poly(lactide-co-glycolic acid); PTX, paclitaxel.
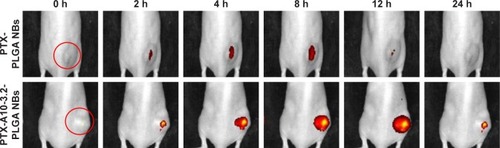
Figure 10 Distribution of different formulations of DiI-labeled NBs in the cryosections of different organ tissues by LCSM and IOD in the different organ tissues.
Notes: (A–E) Distribution of different formulations of DiI-labeled NBs in the tumor, liver, spleen, and kidney. (F) IOD in the tumor, liver, spleen, and kidney. PTX-PLGA NBs compared with PTX-A10-3.2-PLGA NBs, ***P<0.001. Blue indicates cell nuclei; red dots indicate DiI-labeled NBs.
Abbreviations: DAPI, 4′,6-diamidino-2-phenylindole; DiI, 1,1′-dioctadecyl-3,3,3′,3′-tetramethylindocarbocyanine perchlorate; IOD, integrated optical density; LCSM, laser confocal scanning microscopy; NBs, nanobubbles; PLGA, poly(lactide-co-glycolic acid); PTX, paclitaxel.
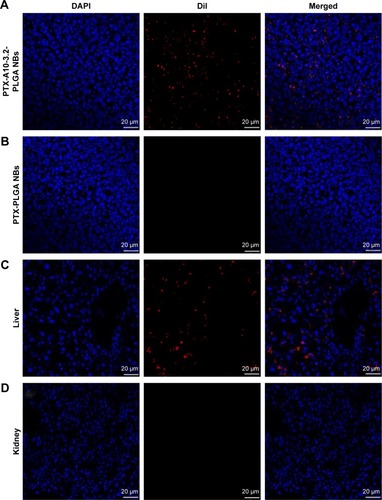
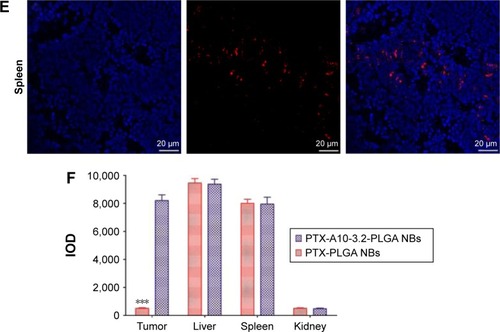
Figure 11 Therapeutic effects in various treatment groups in vivo.
Notes: (A) Tumor volume growth curves in various treatment groups. The red arrow indicates the start of treatment, and the black arrow indicates the end of treatment. (B) Tumor volumes in various treatment groups. (C) TIR in various groups. The saline control group compared with the other groups, **P<0.01; PTX-A10-3.2-PLGA NBs + US compared with the other groups, ##P<0.01; PTX compared with the other groups, ▲▲P<0.01; PTX-PLGA NBs compared with the PTX-A10-3.2-PLGA NBs group, □□P<0.01.
Abbreviations: NBs, nanobubbles; PLGA, poly(lactide-co-glycolic acid); PTX, paclitaxel; TIR, tumor inhibition rate; US, ultrasound.
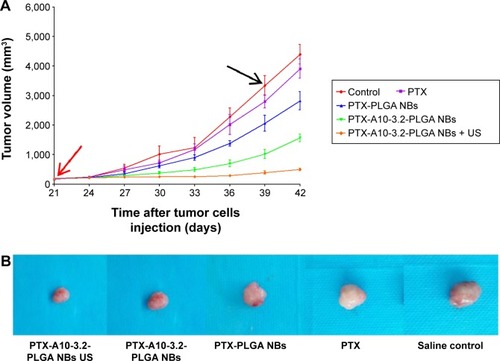
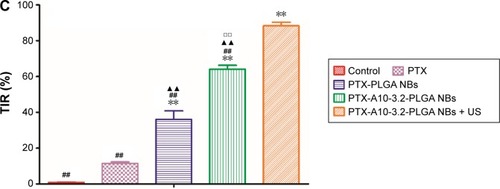
Figure 12 The analysis of survival curve and systemic toxicity in vivo.
Notes: (A) Cumulative survival of tumor-bearing mice after receiving different formulations of PTX. (B) Changes in the body weight after treatment in various groups.
Abbreviations: NBs, nanobubbles; PLGA, poly(lactide-co-glycolic acid); PTX, paclitaxel; US, ultrasound.
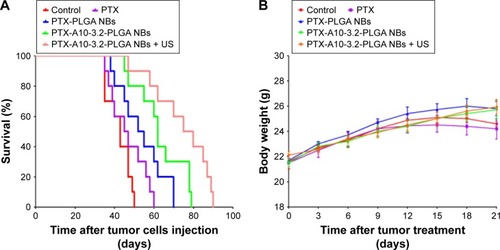
Table 2 Serum markers showing the functions of liver and kidney