Figures & data
Figure 1 Schematic representation of the in vitro system used for DC treatment of B16F10 cells. The cell suspensions are distributed over each individual well and connected to a positive pole (AF) and negative pole (CF). An intermediary well, namely electroionic flow (FEI), is connected to the other wells by filter paper bridges moistened with phosphate saline buffer. Platinum electrodes are inserted into the AF and CF poles, allowing the system to be connected to a DC source and an amperimeter to monitor DC intensity. This distribution permits the separate exposure of cells to cathodic and anodic reactions, and to the DC (FEI). Control cells are exposed to the same conditions, except for the use of DC. Internal volume of each well is 0.84 cm3. The distance between the electrodes was 8 cm, and an electric field of approximately 2.5 V/cm was generated.
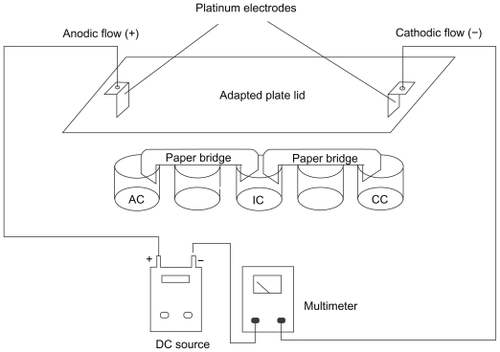
Figure 2 Morphological features and mean diameter of L-tyrosine-loaded PCL NPs. A) Transmission electron micrograph of PCL NPs loaded with L-tyrosine. Scale bar: 100 nm. B) Diameter distribution of PCL NPs loaded with L-tyrosine determined by photon correlation spectroscopy, showing that most NPs presented diameter in the nanometer scale. The experiments were done three times independently (n = 3).
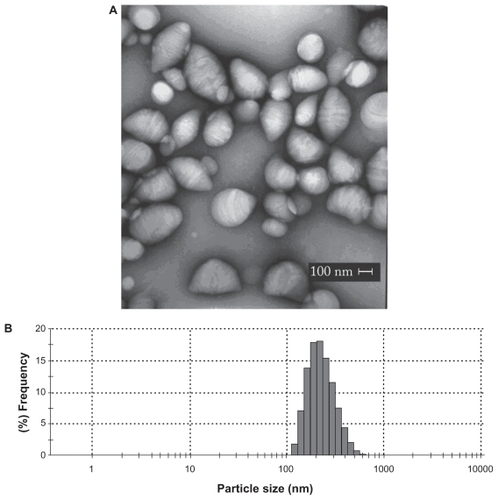
Table 1 Process yield, drug encapsulation efficiency, mean diameter, and PI of blank and l-tyrosine-loaded PCL NPs (n = 3 ± SD)
Table 2 Zeta potential analyses of blank and l-tyrosine-loaded PCL NPs
Figure 3 Release kinetics of l-tyrosine from PCL NPs in a period of 24 h. The experiments were done three times independently (n = 3 ± SD).
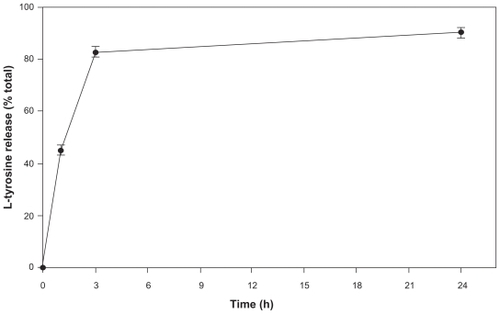
Figure 4 Kinetics of trypan blue incorporation by both treated and untreated B16F10 cells. A) B16F10 cells were treated with 2 mA of DC for periods varying from 0 to 10 min and their viability assayed immediately by the trypan blue method. Black squares represent the viability of control cells (■), and the open symbols represent the cells treated by the CF (⋄), AF (▴), and electroionic flow (□). Anodic and cathodic stimuli induced significant differences in the B16F10 viability when compared to untreated cells (P < 0.01), except for the AF stimulus of 2 min. Besides, the electroionic flow stimuli did not induce any changes in cell viability (P > 0.05). B) B16F10 cells were treated for periods varying from 0 to 10 min, and their viability was assayed by the trypan blue method 24 h after the treatment. Black squares represent the viability of control cells (■), and the open symbols represent the cells treated by the CF (⋄), AF (▴), and electroionic flow (□). This graph shows that the cell viability was not recovered, except for the cells treated for 4 min with the AF stimulus. As detected immediately after treatment, the electroionic flow stimuli did not induce any changes in cell viability (P > 0.05).
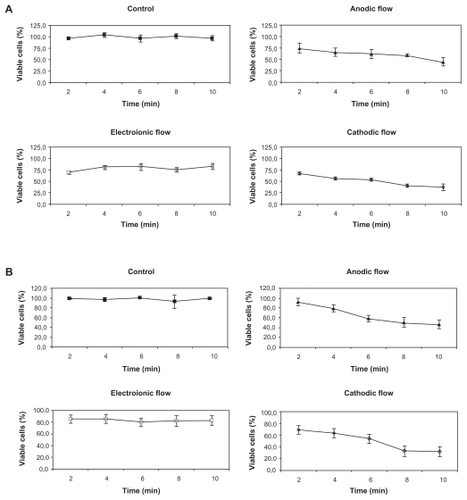
Figure 5 Treatment of B16F10 cells with DC inhibits cell proliferation. Cells were treated with 2 mA of AF for 6 min (▴) and inoculated into fresh media. The number of cells treated and untreated (■) was quantified by trypan blue dye after 24 h and 48 h, considering only the cells that were not permeable to the dye (viable cells). The proliferation rate of treated cells was 54.7% lower than the untreated cells. Results of five independent experiments expressed as mean ± SD are shown.
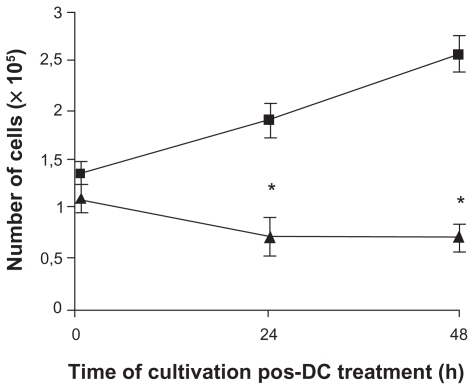
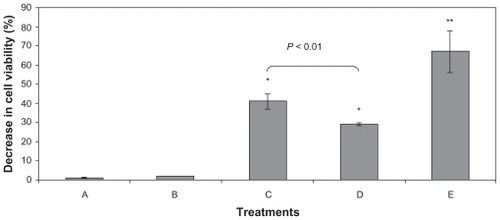
Figure 6 Decrease in the B16F10 viability induced by different experimental conditions measured by MTT assay. Cells were treated with A) L-tyrosine-loaded PCL NPs, B) unloaded NPs, C) 6 min of AF, D) unloaded NPs plus AF, and E) L-tyrosine-loaded PCL NPs plus AF. The percentage of viability decrease was determined immediately (data not shown) and 24 h after treatment. The major cell viability decrease (around 60%) was obtained when the L-tyrosine-loaded PCL NPs were associated with AF. Results of three independent experiments expressed as mean ± SD are shown.
Notes: *Significantly different from control with P < 0.05.