Figures & data
Figure 1 Schematic illustration outlining the delivery of PTX-LIPO using FUS exposure in the presence of circulating MBs.
Notes: Stabilized long-circulating liposomes loaded with paclitaxel were co-injected with MBs through the tail vein of nude mice with intracranial glioblastoma xenografts. Low-intensity pulsed FUS sonication was applied to the GBM xenograft through the intact skull. PTX was delivered into the GBM tissue through the BTB disrupted by FUS with MBs.
Abbreviations: BTB, blood–tumor barrier; FUS, focused ultrasound; GBM, glioblastoma multiforme; MBs, microbubbles; PTX, paclitaxel; PTX-LIPO, paclitaxel liposomes.
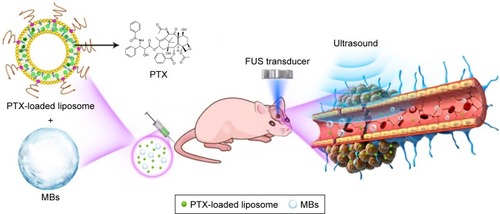
Figure 2 Characterization of the PTX-LIPO and MBs.
Notes: (A) Schematic of the structure of PTX-LIPO. PTX was entrapped within the liposomal phospholipid bilayer. (B) Transmission electron microscopy images of PTX-LIPO, bar: 100 nm. (C) Size distribution of PTX-LIPO. (D) Photomicrograph of MBs with a lipid shell and perfluoropropane core, bar: 20 µm. (E) Size distribution of MBs in number percent. (F) The variations in concentration, mean diameter and d90 of the MBs with time from the time immediately after they were freshly prepared to 5 days after preparation (n=3, mean ± SD).
Abbreviations: MBs, microbubbles; PTX, paclitaxel; PTX-LIPO, paclitaxel liposomes; d90, the size below which 90% of the particles fall.
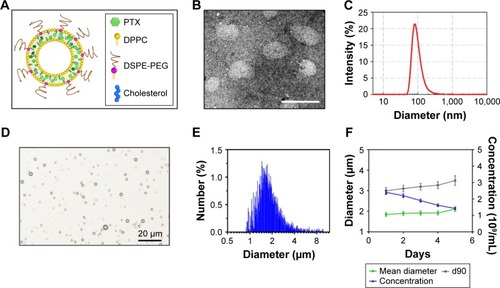
Figure 3 In vivo stability of the MBs and cavitation dose detection during the FUS-induced BBB opening.
Notes: (A) Contrast-enhanced B-mode images of a mouse brain before MB injection. (B) Contrast-enhanced B-mode images of a mouse brain after MB injection. Craniotomy surgery was performed before ultrasound imaging with a 40 MHz transducer. (C) Corresponding time intensity curve of contrast-enhanced B-mode images. (D) Spectra of the acoustic echo signals emitted by the cavitation activities of MBs during the FUS-induced BBB opening at peak-negative rarefactional pressures of 0.4, 0.6 and 0.8 MPa.
Abbreviations: BBB, blood–brain barrier; FUS, focused ultrasound; MBs, microbubbles.
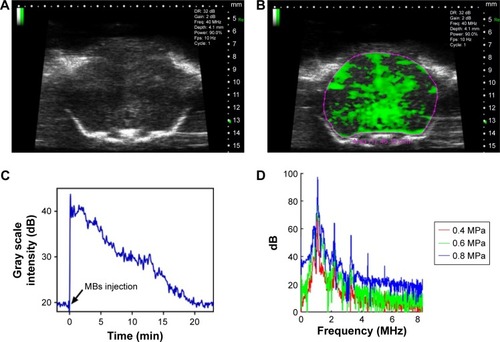
Figure 4 The effect of FUS with MBs on the permeability of the in vitro BBB model.
Notes: (A) Schematic of the in vitro BBB model treated with pulsed FUS exposure with MBs. (B) Immunofluorescence staining of tight junction protein ZO-1 (green) in the in vitro BBB model. The nuclei of bEnd.3 cells were stained with DAPI (blue). Bar: 10 µm. (C) TEER value variation with culture days. (D) The fluorescence of NaF in the receiving chamber leaking through a bEnd.3 monolayer after sonication with or without MBs. (E) Permeability coefficients of the bEnd.3 monolayer to NaF and rhodamine-labeled liposomes with no treatment, treatment with FUS only and treatment with FUS in the presence of MBs. Sonication was performed for 60 s with a 10 ms pulse length and 1 Hz PRF at 0.64 MPa peak-rarefactional pressure (n=3, mean ± SD). *P<0.05, **P<0.01, and ***P<0.001.
Abbreviations: BBB, blood–brain barrier; DAPI, 4′,6-diamidino-2-phenylindole; FUS, focused ultrasound; MBs, microbubbles; NaF, sodium fluorescein; PRF, pulse repetition frequency; TEER, transendothelial electrical resistance.
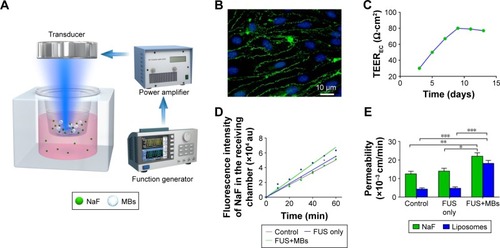
Figure 5 In vitro antiglioma effect of PTX-LIPO.
Notes: (A) The viability over 24 h of U87 MG cells treated with PTX-LIPO at concentrations ranging from 0.01 to 100 µg/mL (n=3, mean ± SD). (B) The percentages of apoptotic and necrotic cells determined by the apoptosis study of U87 MG cells in the following: control group (C), group treated with 2 µg/mL free PTX (D) and groups treated with PTX-LIPO at concentrations of 2 µg/mL (E) and 10 µg/mL (F) (n=3, mean ± SD). *P<0.05, **P<0.01, and ***P<0.001.
Abbreviations: FITC, fluorescein isothiocyanate; PTX-LIPO, paclitaxel liposomes.
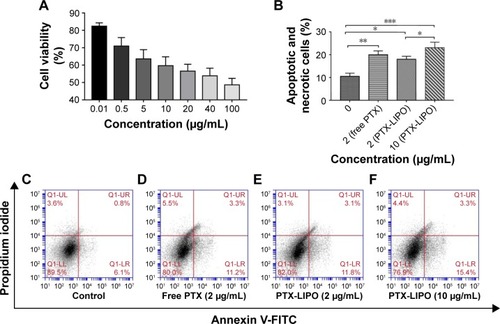
Figure 6 Comparisons of the EB dye or liposomes that penetrate through BTB-compromised glioma to those that penetrate through the BTB disrupted by FUS.
Notes: (A) Experimental timeline of the treatment procedure of the BTB opening in vivo induced by FUS with MBs. (B) EB extravasation in glioblastoma. Left: without FUS sonication with MBs. Right: with FUS sonication with MBs. Note that without treatment with FUS or MBs, EB was distributed heterogeneously within the tumor region. However, after insonification in the presence of MBs, EB spread throughout most of the tumor region. (C) Liposome accumulation in tumor regions through the glioma-compromised BTB (left) and FUS-disrupted BTB (right). The same amount of U87 MG cells was implanted in the bilateral striatum in the nude mouse brains. FUS was only introduced to the right intracranial glioblastoma. (D) Fluorescence intensity of the extravasated liposomes in the left and right tumor regions (n=6, mean ± SD). **P<0.01.
Abbreviations: BTB, blood–tumor barrier; EB, Evans blue; FUS, focused ultrasound; MBs, microbubbles; PTX-LIPO, paclitaxel liposomes.
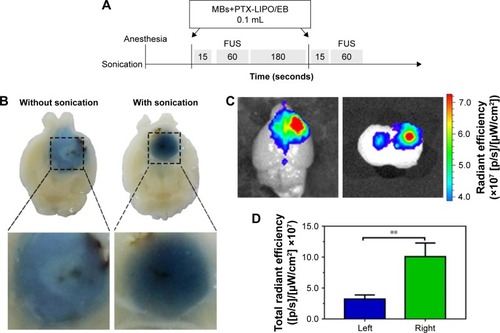
Figure 7 The biodistribution of PTX in nude mice receiving PTX-LIPO only or FUS+MB+PTX-LIPO treatment.
Notes: The drug concentration in the organs and plasma after treatment was quantified using HPLC (n=3, mean ± SD). (A) PTX concentration accumulated in the glioma, heart, liver, spleen, lungs and kidneys of nude mice 1 h after they received PTX-LIPO or FUS+MB+PTX-LIPO treatment. PTX concentrations in (B) plasma and (C) brain tumors at 1, 2 and 3 h after the PTX-LIPO or FUS+MB+PTX-LIPO treatment. *P<0.05, **P<0.01, and ***P<0.001.
Abbreviations: PTX, paclitaxel; PTX-LIPO, paclitaxel liposomes; MBs, microbubbles.
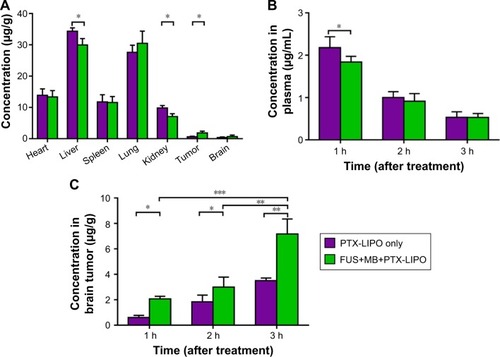
Figure 8 In vivo antiglioma efficacy in nude mice bearing intracranial glioblastoma in different treatment groups: no treatment as the Control, FUS exposure with MBs but without PTX-LIPO as FUS+MB, PTX-LIPO injection only and PTX-LIPO delivery using FUS with MBs as FUS+MB+PTX-LIPO.
Notes: (A) Experimental timeline of the treatment procedure and MRI longitudinal study. Treatments were started from the 10th day after the glioma cell implantation every other 2 days for a total of three times. (B) Representative T2-weighted MRI horizontal images of intracranial U87 MG glioblastoma progression (yellow outline) before and after different treatments. Bar: 5 mm. (C) Tumor volumes from day 10 to day 38 after implantation of nude mice with different treatments (n=10, mean ± SD). *P<0.05 and **P<0.01. (D) The Kaplan–Meier survival curves of nude mice in each treatment group.
Abbreviations: FUS, focused ultrasound; MBs, microbubbles; MRI, magnetic resonance imaging; PTX-LIPO, paclitaxel liposomes.
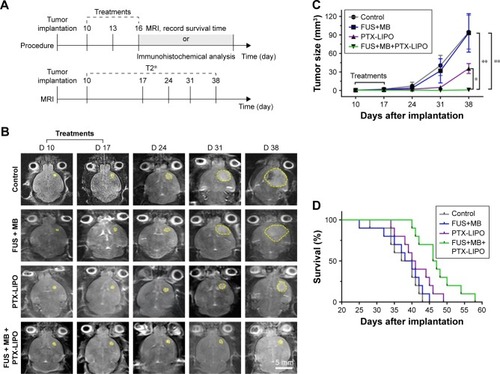
Table 1 Survival analysis of the nude mice in the four treatment groups
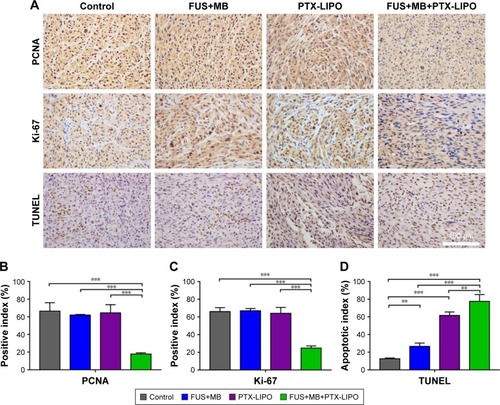
Figure 9 Proliferation and apoptosis analysis of glioblastoma in nude mice receiving different treatments: no treatment as the Control, FUS exposure with MBs but without PTX-LIPO as FUS+MB, PTX-LIPO injection only and PTX-LIPO delivery using FUS with MBs as FUS+MB+PTX-LIPO.
Notes: (A) Representative immunohistochemical staining of glioma sections against PCNA and Ki-67 and for the TUNEL assay. Cell nuclei were counterstained with hematoxylin. Glioma tissue was sampled 48 h after the treatment. Bar: 100 µm. Quantitative analysis of (B) PCNA-positive and (C) Ki-67-positive cells in the tumor region. The positive index was determined from the percentage of positive cells out of at least 2,000 tumor cells observed at 200× magnification. (D) Apoptosis quantification assessed by the percentage of TUNEL-positive cells in the glioma region. **P<0.01 and ***P<0.001.
Abbreviations: FUS, focused ultrasound; MBs, microbubbles; PTX-LIPO, paclitaxel liposomes; TUNEL, terminal dexynucleotidyl transferase-mediated dUTP nick end labeling.