Figures & data
Figure 1 Schematic diagram of E2-HP hydrogel as an in situ administration drug for the treatment of intrauterine adhesions.
Abbreviation: IUA, Intrauterine adhesions.
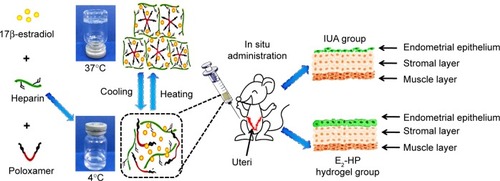
Figure 2 Characteristics of E2-HP hydrogel.
Notes: (A) The state of E2-HP hydrogel at different temperatures (4°C and 37°C). (B) SEM images of the morphology of HP hydrogel (B1) and E2-HP hydrogel (B2). Scale bars in B1 and B2 are 240 μm.
Abbreviation: SEM, scanning electron microscope.
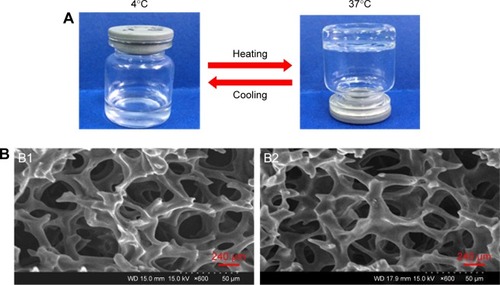
Figure 3 The cumulative release of E2 in vitro.
Notes: Different time points are 0.5, 1, 2, 4, 8, 12, 24, 48, and 72 h. Data are presented as mean ± standard deviation; n=5.
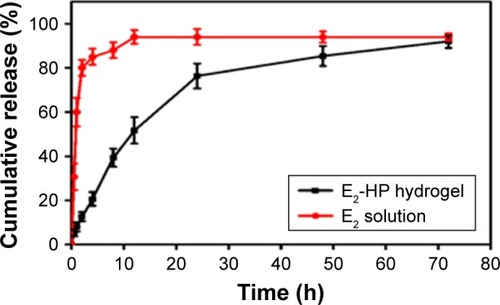
Figure 4 The penetration and retention of different FITC-E2 formulations in the uterus after in situ administration.
Notes: Different time points are 1, 2, 8, 24, and 48 h; n=5.
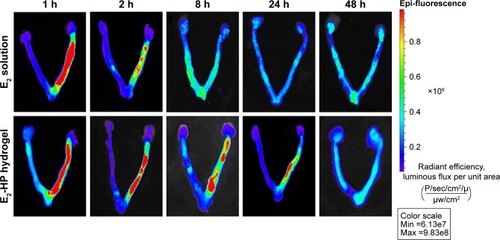
Figure 5 Cell viability of various groups in vitro.
Notes: (A) Endometrial epithelial cells (EECs) were pretreated with H2O2 for 4 h and were treated with different concentrations of E2 solution for 8 h, 12 h, and 24 h. Then, the cell viability was assessed by the CCK-8 assay. *P<0.05 versus H2O2 group. (B) EECs were pretreated with H2O2 for 4 h and were treated with different treatments for 24, 48, and 72 h. Then, the cell viability was assessed by the CCK-8 assay. *P<0.05 and **P<0.01 versus H2O2 group. Data are presented as mean ± standard deviation; n=3.
Abbreviations: CCK-8, cell counting kit-8; EECs, endometrial epithelial cells.
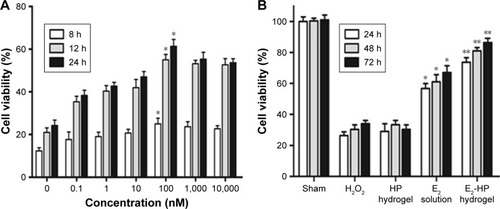
Figure 6 Ultrasonography measurement of the injured uterus in different groups at 14 days after IUA.
Notes: The red dotted lines indicate the uterine cavity. The red arrowheads indicate the endometrial line; n=5.
Abbreviations: IUA, Intrauterine adhesions; HP, heparin-poloxamer.
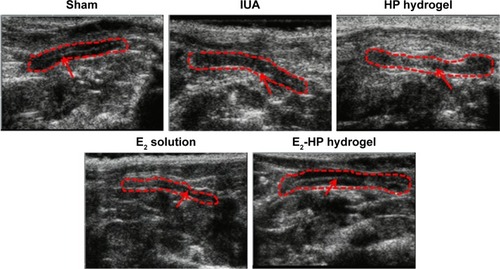
Figure 7 Histological structures of the injured uterus in different groups.
Notes: (A) HE staining of crosscutting results (40× and 200×) at 14 days after IUA. (B) Masson’s trichrome method stain of the collagen (40× and 200×) at 14 days after IUA. (C) Analysis of the number of glands in each group at 14 days after IUA. (D) Analysis of fibrosis area in endometrium in each group at 14 days after IUA. Data are presented as mean ± standard deviation; n=5; *P<0.05, **P<0.01, and ***P<0.001.
Abbreviations: IUA, Intrauterine adhesions; HE, haematoxylin-eosin staining; HP, heparin-poloxamer.
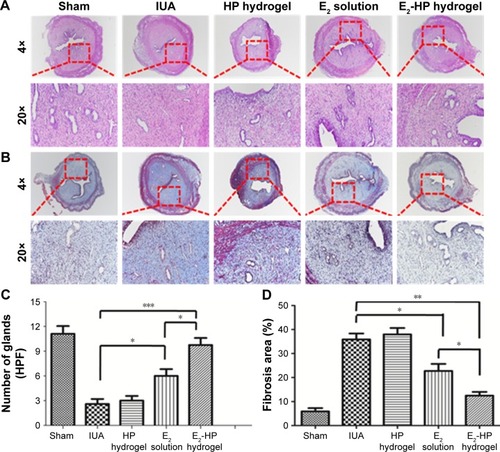
Figure 8 Immunohistochemical staining of Ki67, TGF-β, and VEGF.
Notes: (A) The expression of Ki67, TGF-β, and VEGF in the immunohistochemical staining of endometrium (400×) on the 14th day after IUA with different treatments. (B) Analysis of Ki67 positive cells of the immunohistochemistry results. (C) Analysis of TGF-β positive area of the immunohistochemistry results. (D) Analysis of VEGF-positive cells of the immunohistochemistry results. Data are presented as mean ± standard deviation; n=5; *P<0.05, **P<0.01, and ***P<0.001.
Abbreviations: IUA, Intrauterine adhesions; HP, heparin-poloxamer.
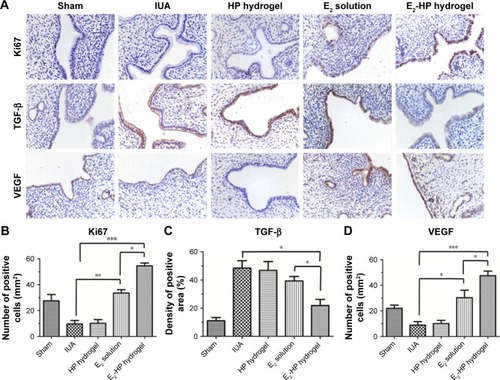
Figure 9 E2-HP hydrogel inhibits ER stress-induced apoptosis in IUA rats.
Notes: (A) Immunohistochemistry for GRP78, caspase-12, and CHOP (400×) on the 14th day after different treatments with IUA; (B) Quantitative analysis of GRP78-positive cells of the immunohistochemistry results. (C) Quantitative analysis of caspase-12-positive cells of the immunohistochemistry results. (D) Quantitative analysis of CHOP-positive cells of the immunohistochemistry results. Data are presented as mean ± standard deviation; n=5; *P<0.05 and ***P<0.001.
Abbreviations: CHOP, C/EBP homologous protein; ER, endoplasmic reticulum; GRP78, glucose-regulated protein; IUA, Intrauterine adhesions; HP, heparin-poloxamer.
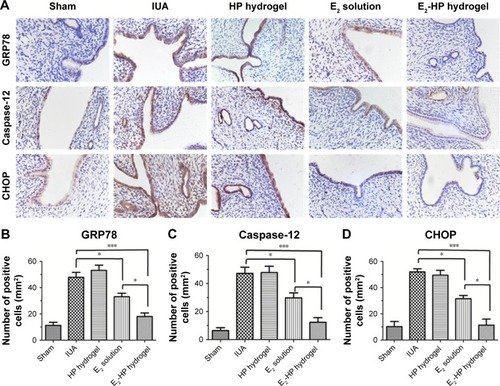
Figure 10 E2-HP hydrogel inhibits ER stress and activates the Akt and ERK1/2 pathways in the IUA rats.
Notes: (A) The protein expressions of VEGF, GRP78, caspase-12, CHOP, p-Akt, and p-ERK in each group were tested with Western blotting. GAPDH was used as the loading control and for band density normalization. (B) The optical density analysis of GRP78, caspase-12, and CHOP protein. **P<0.01 versus the Sham group and #P<0.05 and ##P<0.01 versus the IUA group. (C) The optical density analysis of VEGF, p-Akt, and p-ERK protein. **P<0.01 versus the Sham group and #P<0.05 and ##P<0.01 versus the IUA group. Data are presented as mean ± standard deviation; n=3.
Abbreviations: CHOP, C/EBP homologous protein; ER, endoplasmic reticulum; GRP78, glucose-regulated protein; IUA, Intrauterine adhesions; HP, heparin-poloxamer.
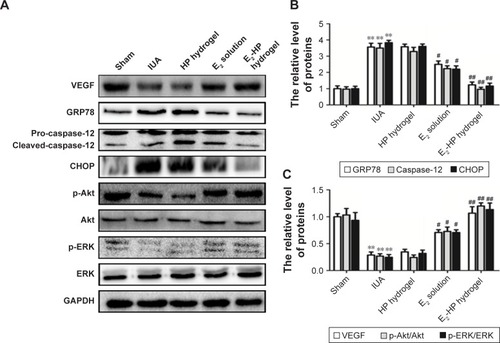
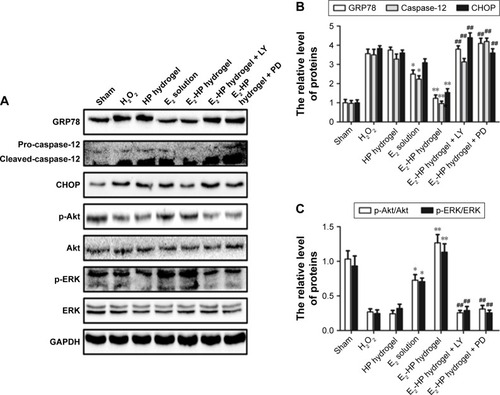
Figure 11 The activation of Akt and ERK1/2 is crucial for the protective effect of E2-HP hydrogel in H2O2-induced ER stress in EECs.
Notes: (A) The protein expressions of GRP78, caspase-12, CHOP, p-Akt, and p-ERK1/2 in ER stress-induced apoptosis in EECs treated with E2-HP hydrogel and different inhibitors. GAPDH was used as the loading control and for band density normalization. (B) The optical density analysis of GRP78, caspase-12, and CHOP protein. (C) The optical density analysis of p-AKT and p-ERK protein. *P<0.05 and **P<0.01 versus the H2O2 group and ##P<0.01 versus the E2-HP hydrogel group. Data are presented as mean ± standard deviation; n=3.
Abbreviations: CHOP, C/EBP homologous protein; EECs, endometrial epithelial cells; ER, endoplasmic reticulum; GRP78, glucose-regulated protein; HP, heparin-poloxamer.