Figures & data
Table 1 MRI sequence parameters
Figure 1 Hemocompatibility of SPIONdex.
Notes: (A) Erythrocyte lysis: erythrocyte lysis test of SPIONdex. Free hemoglobin in supernatant serves as marker for damage of erythrocytes. The experiment was performed with the blood of three healthy donors in triplicates. The controls used were: NC (erythrocytes in PBS); VC (erythrocytes in PBS + H2O); PC (erythrocytes in PBS + 1% Triton X-100); inhibition/enhancement control (PC + SPIONdex). (B) Coagulation time: Platelet poor human plasma was treated with SPIONdex for 30 min, followed by adding the respective coagulation activation reagent to each sample (Neoplastine for prothrombin time, CaCl2 for APTT, and thrombin for thrombin time) and subsequently coagulation time was measured. (C) Complement activation: human plasma was incubated with SPIONdex, followed by analysis of complement split products: iC3b component of complement, Bb component of complement for alternative activation pathway, and C4d component of complement for classical activation pathway. CVF and Cremophor served as positive controls. Mean ± standard deviation of replicate samples of plasma pooled from three donors are shown.
Abbreviations: APTT, activated partial thromboplastin time; ATP, adenosine triphosphate; CSPC, complement split product component; CVF, cobra venom factor; IEC, inhibition/enhancement control; Fe, iron; NC, negative control; PBS, phosphate-buffered saline; PC, positive control; SPIONdex, dextran-coated superparamagnetic iron oxide nanoparticles; VC, vehicle control.
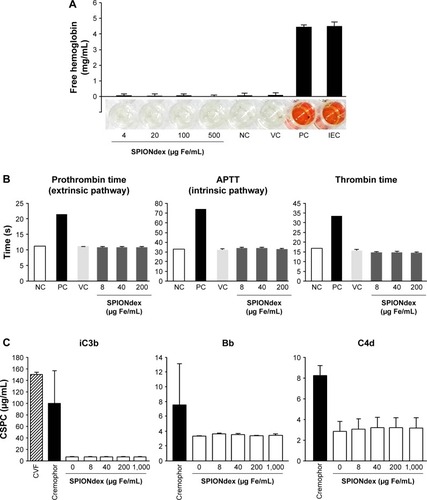
Figure 2 Effects of SPIONdex on white blood cells.
Notes: (A) Unstimulated leukocytes were incubated for 72 h with SPIONdex. (B) Leukocyte proliferation was stimulated with PHA in the presence or absence of SPIONdex. Cell proliferation is expressed as a percentage of untreated control. Mean ± SD of replicate samples of leukocytes pooled from three donors are shown. (C) HUVECs were exposed to non-uniform shear stress for 18 h, followed by stimulation with TNF-α for 2 h, and perfusion with THP-1 monocytic cells. The graph shows numbers of firmly adherent cells (mean ± SEM of three independent experiments). (D) THP-1 monocytic cells were incubated with SPIONdex for 2 h under constant stirring, followed by 1 h chemotaxis to MCP-1 using a modified Boyden chamber assay. Data are expressed as fold of NC (mean ± SEM of four independent experiments). *P<0.05, **P<0.01.
Abbreviations: HUVECs, human umbilical vein endothelial cells; MCP-1, monocyte chemoattractant protein-1; NC, negative control; PHA, phytohemagglutinin; SD, standard deviation; SEM, standard error of the mean; SPIONdex, dextran-coated superparamagnetic iron oxide nanoparticles; THP-1, a human monocytic cell line; TNF-α, tumor necrosis factor-alpha.
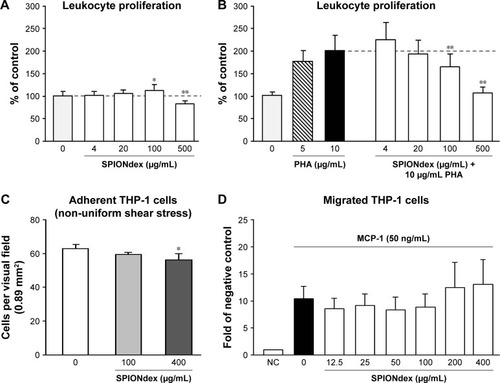
Figure 3 Internalization of SPIONdex by cells.
Notes: Cells were incubated with SPIONdex as indicated. Iron content was measured in cell pellets containing specified number of cells. Note the y-axis scale differences for HUVECs and THP-1 cells versus macrophages. *P<0.05, **P<0.01, and ***P<0.001 vs unstimulated control.
Abbreviations: Fe, iron; HUVECs, human umbilical vein endothelial cells; THP-1, a human monocytic cell line; SPIONdex, dextran-coated superparamagnetic iron oxide nanoparticles.
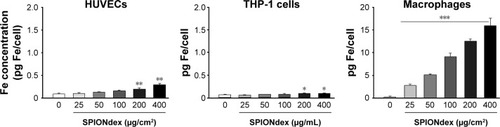
Figure 4 Cardiovascular reaction to SPIONdex in a pig model of CARPA.
Notes: (A) Saline and SPIONdex (0.5 mg Fe/kg), followed by 5 mg/kg SPIONdex and zymosan IV bolus injections. PAP, SAP, and HR were continuously monitored for up to 30 min. (B) TXB2 plasma concentrations in relation to PAP changes upon administration of SPIONdex (0.5 mg Fe/kg), followed by 5 mg/kg SPIONdex and 0.1 mg/kg zymosan. Mean values of two independent experiments are shown.
Abbreviations: CARPA, complement activation-related pseudoallergy; Fe, iron; HR, heart rate; IV, intravenous; PAP, pulmonary arterial blood pressure; SAP, systemic arterial blood pressure; SPIONdex, dextran-coated superparamagnetic iron oxide nanoparticles; TXB2, thromboxane B2.
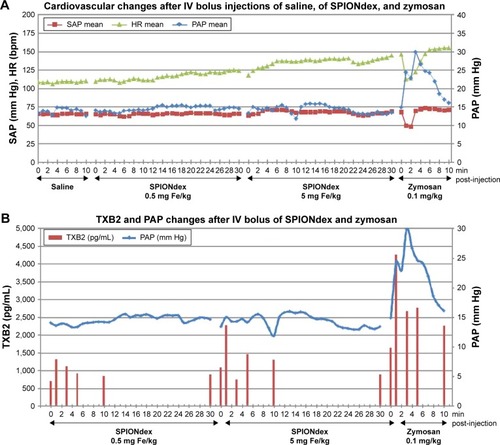
Figure 5 Relaxation times of SPIONdex concentration series. The 0.2 mL microcentrifuge tubes were filled with 0, 1:10,000, and 1:1,000 SPIONdex (7.57 mg Fe/mL stock solution) in 1% agarose gel and embedded in 5% agarose gel.
Notes: (A) Color-coded maps of agarose-embedded SPIONdex show reduced T1-, T2-, and T2*-times with the increasing iron content. Diameter of the vials shown =8 mm. (B) T1-, (C) T2- and (D) T2*-relaxation times. Data are expressed as mean ± standard deviation of quadruple measurements. *P<0.05 vs agarose control.
Abbreviations: Fe, iron; SPIONdex, dextran-coated superparamagnetic iron oxide nanoparticles.
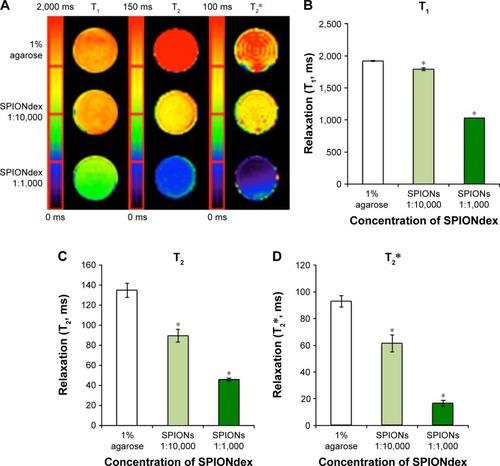
Table 2 List of all measured relaxations times
Figure 6 Contrast-enhanced MRI with SPIONdex in vivo. SPIONdex (2.6 mg iron/kg bodyweight) were administered intravenously via retroorbital injection.
Notes: (A) The representative T2-weighted hepatic MRI images before the administration, within 15 min post-administration, and at 3 and 24 h post-administration (liver is indicated by the yellow ellipse). Signal intensity decreases in the liver directly after the injection, and the hyposignal remained observable 24 h after SPIONdex injection. (B) Histological analysis. Iron accumulation in liver at 26 h post-administration was detected using Prussian blue stain. Representative images at ×20 magnification (left panel) or ×40 magnification (right panel) are shown.
Abbreviations: MRI, magnetic resonance imaging; SPIONdex, dextran-coated superparamagnetic iron oxide nanoparticles.
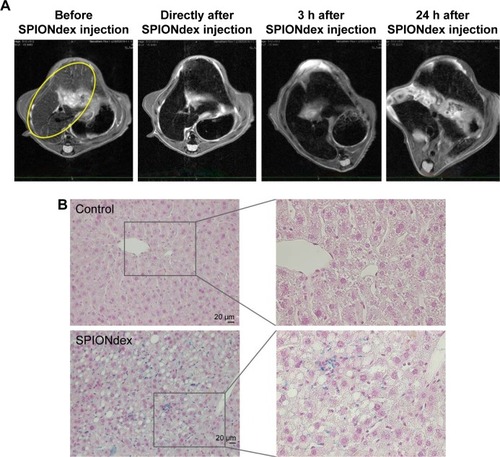
Figure 7 Hydrodynamic size and corresponding volume susceptibility of dextran-coated iron oxide nanoparticles, in dependence of the iron concentration during coprecipitation.
Notes: (A and B) Fe concentration during coprecipitation reaction was varied between 70 and 150 mM at two different dextran concentrations: 11.3% (w/w) and 6.9% (w/w). (C and D) The volume susceptibility is a dimensionless parameter, which can be determined in the SI or cgs unit system. The presented values are given in the SI unit system. TEM images of (E) larger and (F) smaller particles are shown.
Abbreviations: cgs, centimeter-gram-second; Fe, iron; SI, international system of units; TEM, transmission electron microscopy.
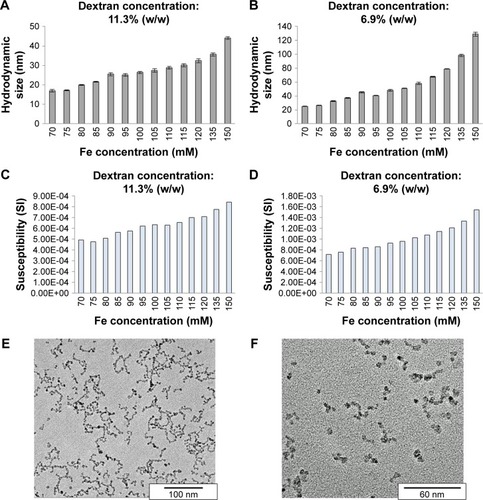
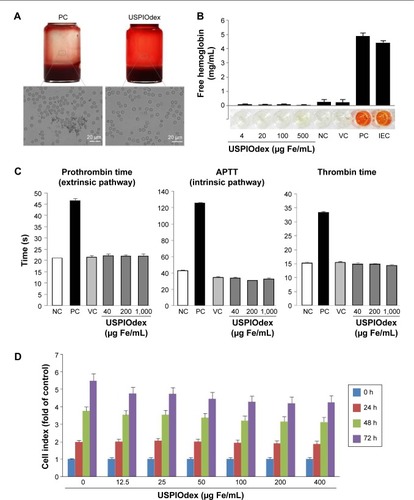
Figure 8 Hemo- and biocompatibility of ultra-small dextran-coated iron oxide nanoparticles.
Notes: (A) Investigation on the blood stability of USPIOdex in EDTA-anticoagulated rabbit whole blood. Blood sample was mixed with USPIOdex to an iron concentration of 1 mg/mL. Microscopic images were taken after 45 min of incubation. PC: lauric acid-coated SPIONs. (B) Erythrocyte lysis: erythrocyte lysis test of USPIOdex. Free hemoglobin in supernatant serves as marker for damage of erythrocytes. NC: erythrocytes in PBS; VC: erythrocytes in PBS + H2O; PC: erythrocytes in PBS + 1%Triton X-100; IEC (PC + USPIOdex). (C) Coagulation time: platelet poor human plasma was treated with USPIOdex for 30 minutes, followed by adding the respective coagulation activation reagent to each sample (Neoplastine for prothrombin time, CaCl2 for APTT, and thrombin for thrombin time) and subsequent coagulation time measurement. (D) USPIOdex effects on ECs viability was investigated using real-time cell analysis (xCELLigence system). HUVECs were seeded at 2×10³ cells per well. At 24 h after seeding, medium containing USPIOdex was added to the wells. Cell growth was monitored every 10 min for 72 h.
Abbreviations: APTT, activated partial thromboplastin time; ECs, endothelial cells; EDTA, ethylenediaminetetraacetic acid; Fe, iron; IEC, inhibition/enhancement control; NC, negative control; PBS, phosphate-buffered saline; PC, positive control; USPIOdex, dextran-coated ultra-small superparamagnetic iron oxide nanopareticles; VC, vehicle control.