Figures & data
Figure 1 Diagram of in vivo DVDMS-PACT treatment protocol.
Notes: Burn-infected mice were randomly divided into four groups (eight wounds per group): model, 2 μM PACT, 5 μM PACT, and 10 μM PACT. The model mice did not receive any treatment. The laser was utilized with a power intensity of 300 mW/cm2. Finally, concentrations of TNFα, TGFβ1, VEGF, bFGF, IL6, and Hyp were detected using ELISA at different time points.
Abbreviations: DVDMS, sinoporphyrin sodium; ELISA, enzyme-linked immunosorbent assay; Hyp, hydroxyproline; PACT, photodynamic antimicrobial chemotherapy; ROS, reactive oxygen species.
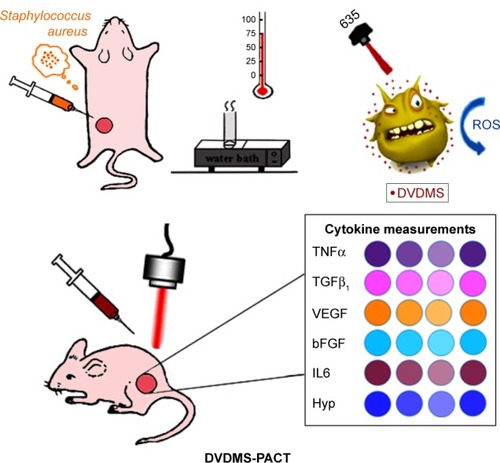
Figure 2 Uptake of DVDMS by Staphylococcus aureus/MDR S. aureus.
Notes: DVDMS uptake in S. aureus/MDR S. aureus. Bacteria were loaded with 5 μM DVDMS (right panels) and PBS (negative control, left panels) for 75 minutes. (A) S. aureus; (B) MDR S. aureus. The peak was reached at 75 minutes. Magnification is 63×.
Abbreviations: DVDMS, sinoporphyrin sodium; MDR, multidrug-resistant.
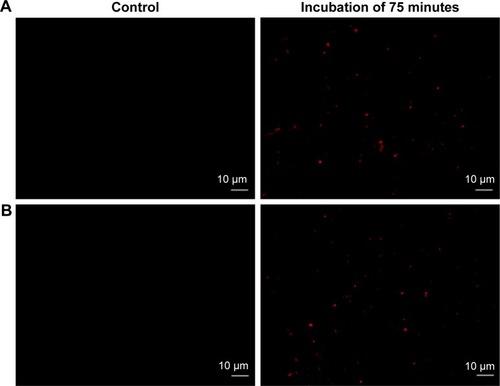
Figure 3 CFU assay of Staphylococcus aureus/MDR S. aureus after DVDMS-PACT treatment.
Notes: Bacterial cells were incubated with 2 μM and 5 μM DVDMS for 75 minutes and irradiated by different light doses. (A) S. aureus: control, negative control; 2 μM, 5 μM, DVDMS treatment alone; 10 J/cm2, 30 J/cm2, 50 J/cm2, PACT treatment of 5 μM DVDMS and different light doses. (B) MDR S. aureus: variables as per A. Data expressed as means ± SD of three experiments. *P<0.05 vs control.
Abbreviations: CFU, colony-forming unit; DVDMS, sinoporphyrin sodium; MDR, multidrug-resistant; PACT, photodynamic antimicrobial chemotherapy.
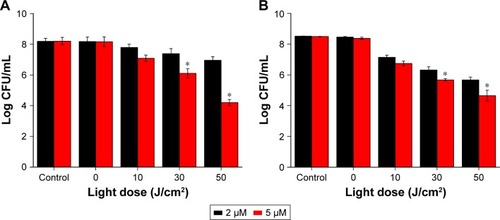
Figure 4 ROS detection by flow cytometry.
Notes: ROS production in Staphylococcus aureus/MDR S. aureus was measured after DVDMS-PACT treatment. Bacteria were preincubated with H2-DCF-DA (10 μM), followed by illumination exposure at different light doses of 10, 30, and 50 J/cm2 in the presence of DVDMS (5 μM). Cytofluorometric profiles represent the distribution of bacterial cells after staining with H2-DCF-DA (S. aureus [A], MDR S. aureus [B]). Control, negative control; light alone, only irradiation 50 J/cm2 light dose; DVDMS alone, bacteria treated with 5 μM DVDMS alone. **P<0.01 vs untreated controls; #P<0.05 for S. aureus vs MDR S. aureus. (C) Distribution of the intensity of DCF + bacteria in different groups.
Abbreviations: DA, diacetate; DCF, dichlorodihydrofluorescein; DVDMS, sinoporphyrin sodium; MDR, multidrug-resistant; PACT, photodynamic antimicrobial chemotherapy; ROS, reactive oxygen species.
![Figure 4 ROS detection by flow cytometry.Notes: ROS production in Staphylococcus aureus/MDR S. aureus was measured after DVDMS-PACT treatment. Bacteria were preincubated with H2-DCF-DA (10 μM), followed by illumination exposure at different light doses of 10, 30, and 50 J/cm2 in the presence of DVDMS (5 μM). Cytofluorometric profiles represent the distribution of bacterial cells after staining with H2-DCF-DA (S. aureus [A], MDR S. aureus [B]). Control, negative control; light alone, only irradiation 50 J/cm2 light dose; DVDMS alone, bacteria treated with 5 μM DVDMS alone. **P<0.01 vs untreated controls; #P<0.05 for S. aureus vs MDR S. aureus. (C) Distribution of the intensity of DCF + bacteria in different groups.Abbreviations: DA, diacetate; DCF, dichlorodihydrofluorescein; DVDMS, sinoporphyrin sodium; MDR, multidrug-resistant; PACT, photodynamic antimicrobial chemotherapy; ROS, reactive oxygen species.](/cms/asset/d0b60b13-430c-4a46-a5f4-e698fec21639/dijn_a_12193667_f0004_c.jpg)
![Figure 4 ROS detection by flow cytometry.Notes: ROS production in Staphylococcus aureus/MDR S. aureus was measured after DVDMS-PACT treatment. Bacteria were preincubated with H2-DCF-DA (10 μM), followed by illumination exposure at different light doses of 10, 30, and 50 J/cm2 in the presence of DVDMS (5 μM). Cytofluorometric profiles represent the distribution of bacterial cells after staining with H2-DCF-DA (S. aureus [A], MDR S. aureus [B]). Control, negative control; light alone, only irradiation 50 J/cm2 light dose; DVDMS alone, bacteria treated with 5 μM DVDMS alone. **P<0.01 vs untreated controls; #P<0.05 for S. aureus vs MDR S. aureus. (C) Distribution of the intensity of DCF + bacteria in different groups.Abbreviations: DA, diacetate; DCF, dichlorodihydrofluorescein; DVDMS, sinoporphyrin sodium; MDR, multidrug-resistant; PACT, photodynamic antimicrobial chemotherapy; ROS, reactive oxygen species.](/cms/asset/bfc12ea6-1d6d-4232-bc45-49579ab4cba0/dijn_a_12193667_f0004b_c.jpg)
Figure 5 Flow cytometry and fluorescence microscopy to illustrate bacterial viability.
Notes: (A) Membrane permeability of Staphylococcus aureus was measured using flow cytometry after DVDMS-mediated photodynamic action. Data shown as means ± SD. (B) Cells were SYTO 9 (green)–PI (red) double-stained and viewed under fluorescence microscopy. (C, D) Same as A and B; bacteria MDR S. aureus. Magnification is 40×.
Abbreviations: DVDMS, sinoporphyrin sodium; MDR, multidrug-resistant; PACT, photodynamic antimicrobial chemotherapy; PI, propidium iodide.
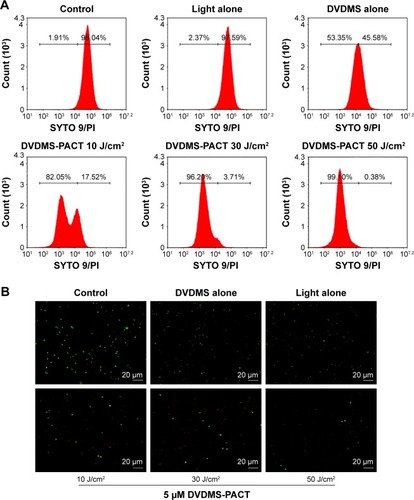
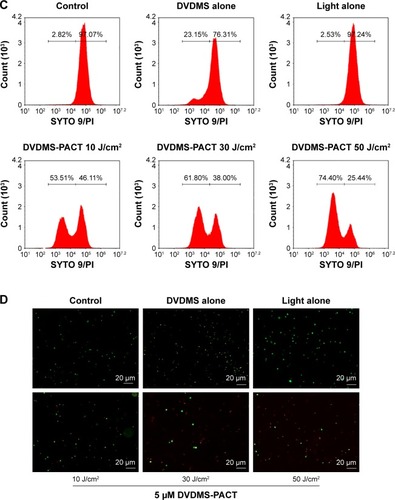
Figure 6 Effects on DNA fragmentation of Staphylococcus aureus.
Notes: Bacterial cells were treated with light alone, DVDMS alone, and PACT, then stained with PI and analyzed by flow cytometry. (A, B) DNA damage vs PI fluorescence. Data expressed as means ± SD of three independent experiments. **P<0.01 vs control; ##P<0.01 vs DVDM alone and light alone.
Abbreviations: DVDMS, sinoporphyrin sodium; MDR, multidrug-resistant; PACT, photodynamic antimicrobial chemotherapy; PI, propidium iodide.
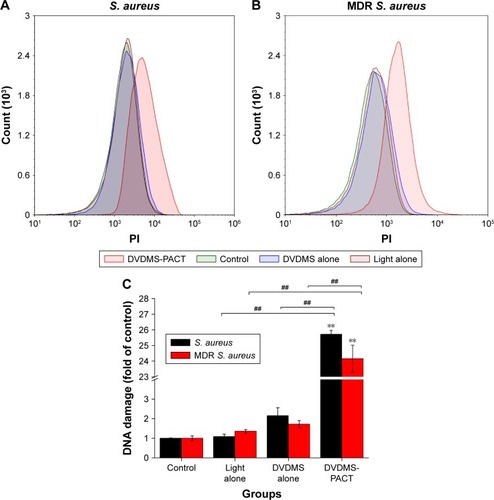
Figure 7 Different factors determined by ELISA.
Notes: (A) bFGF levels were determined by ELISA in the four different groups at 1, 2, 3, and 7 days following full-thickness injury of mice. (B) IL6 levels were determined by ELISA in the four different groups at 1, 2, 3, and 7 days following full-thickness injury of rats. (C) TNFα levels were determined by ELISA in the four different groups at 1, 2, 3, and 7 days following full-thickness injury of rats. (D) VEGF levels were determined by ELISA in the five different groups at 1, 2, 3, 7, and 14 days following full-thickness injury of rats. *P<0.05, **P<0.01. Data shown as means ± SD from eight mice in each group.
Abbreviation: ELISA, enzyme-linked immunosorbent assay.
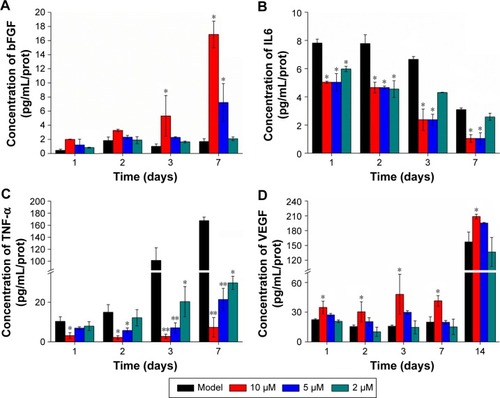
Figure 8 Factor levels of traumatic skin tissue at different times.
Notes: (A) TGFβ1 levels were determined by ELISA in the groups at 1, 2, 3, 7, and 14 days following full-thickness injury of rats. (B) Hyp levels were tested in the groups at 7, 14, 21 days following full-thickness injury of rats. (C) MDA levels were tested in the groups at 14 days following full-thickness injury of rats. *P<0.05. Data shown as means ± SD from eight mice in each group.
Abbreviations: ELISA, enzyme-linked immunosorbent assay; Hyp, hydroxyproline; MDA, malondialdehyde.
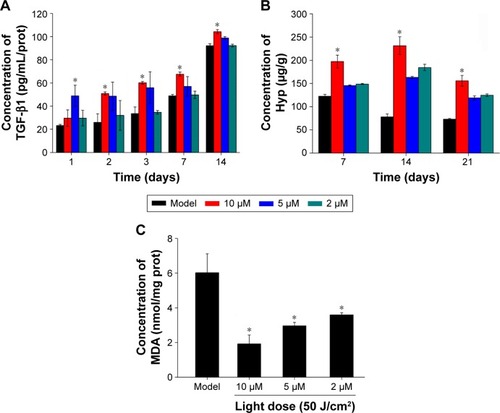
Figure 9 CFU assay of Staphylococcus aureus and MDR S. aureus of skin tissue at different times.
Notes: (A) Representative bacterial colonies on trypticase soy agar are shown. (B) MDR S. aureus CFU counts in PACT treatment and the model group (without any treatment) were assessed with 20 μM DVDMS at different times. (C) Bacteria counts of S. aureus with 10 μM DVDMS treatment at different times. Data expressed as means ± SD of three independent experiments. *P<0.05; **P<0.01. (D) Wound observation at different times after PACT treatment.
Abbreviations: DVDMS, sinoporphyrin sodium; MDR, multidrug-resistant; PACT, photodynamic antimicrobial chemotherapy.
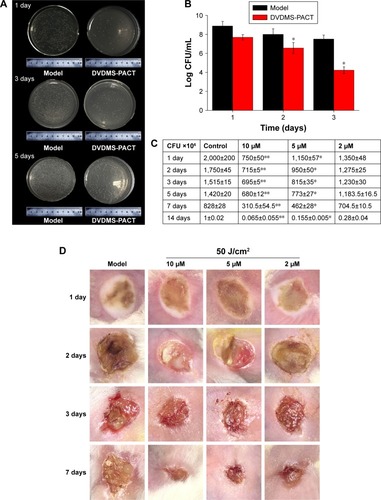
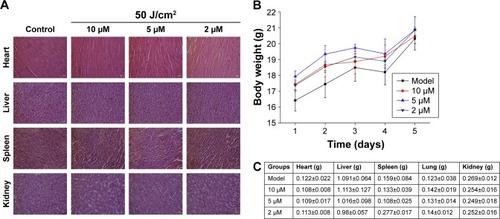
Figure 10 Evaluation of side effects using DVDMS-PACT.
Notes: (A) Effect of different treatments on structural changes in major organs in mice. Major organ sections were stained with H&E. Histopathological changes were observed under light microscopy. (B) Body weight versus number of days after different treatments. (C) Weight of major organs in the mice. Data shown as means ± SD from eight mice in each group.
Abbreviations: DVDMS, sinoporphyrin sodium; PACT, photodynamic antimicrobial chemotherapy.