Figures & data
Figure 1 Schematic representation of lamellar, hexagonal, and cubic liquid-crystal mesophases formed by surfactant-molecule self-assembly.
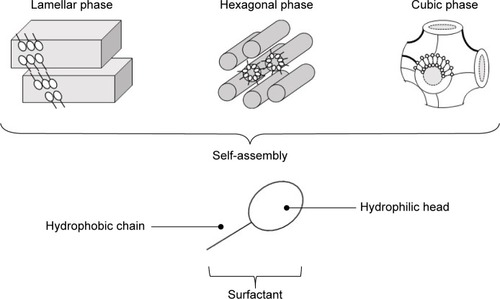
Figure 2 Ternary-phase diagram of copaiba oil as the oily phase (O), hydrogenated castor oil as the surfactant (S), and water (W).
Note: Red points indicate the selected formulations.
Abbreviations: PS, phase separation; VSs, viscous systems; TLSs, transparent liquid systems.
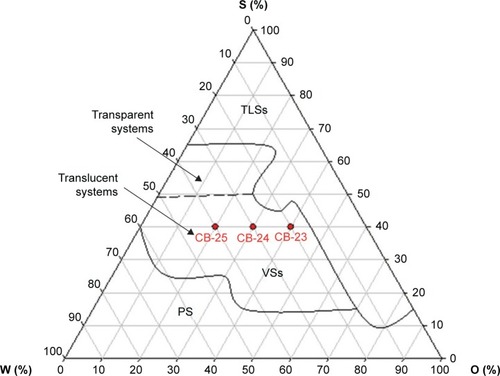
Table 1 Composition of the studied formulations
Figure 3 Characterization of the liquid-crystalline dispersions.
Notes: (A) Macroscopic appearance, (B) photomicrographs obtained by polarized light microscopy (figures were obtained at 40× magnification and the enlarged area at 250× magnification), and (C) small-angle X-ray scattering patterns of the samples.
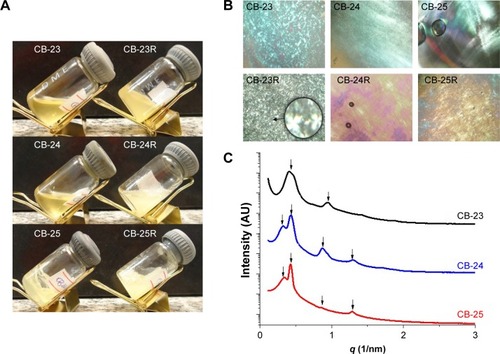
Table 2 Peak positions (q) of the SAXS curves, interplanar distances (d), and classification of formulations
Table 3 Flow index (n) and consistency index (k) of all formulations obtained from the power law (n=3)
Figure 4 Flow rheograms of unloaded and Res-loaded formulations.
Notes: (A) Flow rheograms of unloaded formulations; (B) flow rheograms of Res-loaded formulations. The closed symbols represent up curves, and open symbols represent down curves. The standard deviations were omitted for clarity; however, in all cases, coefficients of variation of triplicate analyses were less than 10%. Analysis was carried out at 32°C±0.5°C.
Abbreviation: Res, resveratrol.
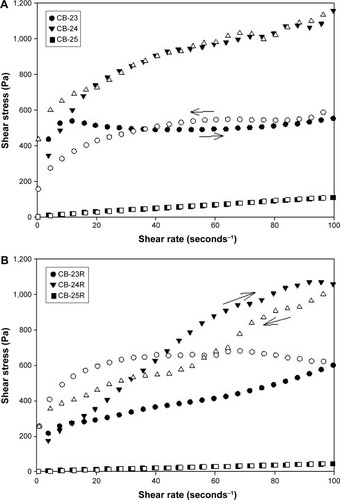
Table 4 Mechanical and bioadhesion properties of the loaded and unloaded formulations (n=3)
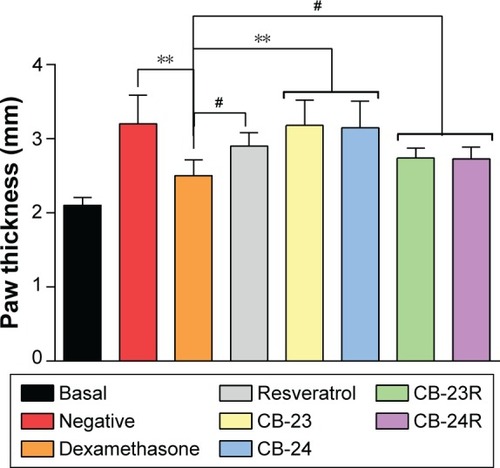
Figure 5 Anti-inflammatory activity of Res-loaded formulations (CB-23R and CB-24R).
Notes: Res-unloaded formulations served as the vehicle, an ointment containing dexamethasone 0.5% (w:w) was used as the positive control, and untreated mice were considered the negative control. Data represent means ± standard deviation of five mice. The statistical significance of the differences in paw thickness between the groups was analyzed using analysis of variance followed by Dunnett’s multiple-comparison test. **P<0.01; #no significance.
Abbreviation: Res, resveratrol.