Figures & data
Figure 1 OPSS-liposomes specifically bind complement C3 proteins.
Notes: OPSS-liposomes (OPSS) and control-liposomes (Control) were exposed to serum containing complement C3. Colloidal gold stain shows all serum proteins bound to liposomes (left panel). Immunodetection with anti-C3 antibody (right panel) shows that OPSS-liposomes bind complement C3 and its activated fragments, while control-liposomes do not. The migration of molecular weight markers is indicated on the left side of the blot.
Abbreviation: OPSS, orthopyridyl disulfide.
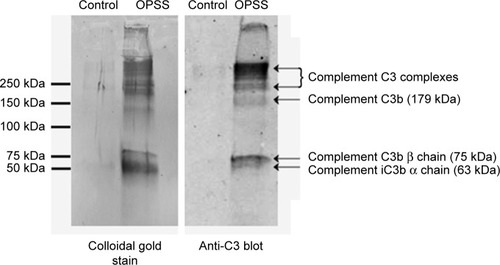
Figure 2 OPSS-liposomes are internalized by white blood cells with CR3.
Notes: Uptake of liposomes was detected by the presence of rhodamine in the cells. Binding of complement C3 to OPSS-liposomes directs internalization into cells via CR3 (CD11b). Non-OPSS-liposomes (control) display limited internalization by cells. OPSS-liposomes and control-liposomes are not readily internalized into cells when incubated in serum depleted of complement C3 (C3−), demonstrating the necessity of the C3–OPSS complex for internalization.
Abbreviations: CR3, complement receptor 3; OPSS, orthopyridyl disulfide.
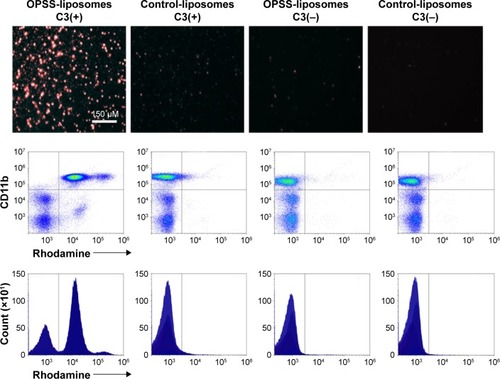
Figure 3 Flow cytometry gating strategy for isolating MDSCs.
Notes: Leukocytes were selected as CD45+. M-MDSCs were identified based on the phenotype: CD33+/Hi, CD11b+, HLA-DR−/low, and CD14Hi. Identification of G-MDSCs was based on: CD33+/low, CD11b+, HLA-DR−, CD14−, and CD15+. Neutrophils were identified as CD33mid/low, CD15+.
Abbreviations: FSC, forward scatter; G-MDSCs, granulocytic myeloid-derived suppressor cells; M-MDSCs, monocytic myeloid-derived suppressor cells; SSC, side scatter.
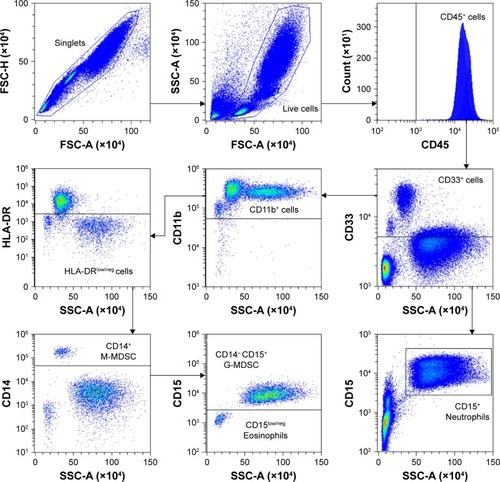
Figure 4 MDSCs and granulocytes internalize OPSS-liposomes.
Notes: M-MDSC show high uptake of rhodamine-labeled OPSS-liposomes. G-MDSC also display high uptake of rhodamine-labeled OPSS-liposomes. In contrast, both M-MDSC and G-MDSC showed limited uptake of control-liposomes or OPSS-liposomes incubated in serum depleted of complement C3 (C3−). A high percentage of both neutrophils and eosinophils internalize OPSS-liposomes incubated in serum containing C3, while less than 8% of granulocytes internalize liposomes when either the OPSS group, complement C3, or both are absent. Data are expressed as mean ± standard error (n=5).
Abbreviations: G-MDSC, granulocytic myeloid-derived suppressor cell; M-MDSC, monocytic myeloid-derived suppressor cell; OPSS, orthopyridyl disulfide.
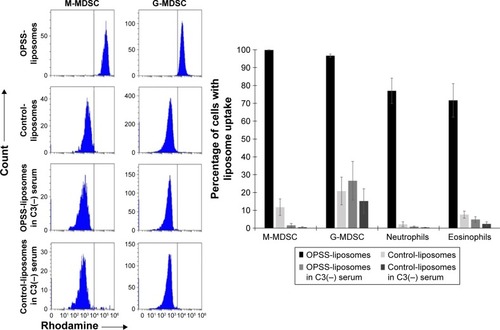
Figure 5 Flow cytometry gating strategy for isolating APC.
Notes: B cells were isolated based on SSC vs FSC and on the phenotype: HLA-DR+, CD20+. Macrophages were identified as HLA-DR+, CD14+/Hi. Myeloid dendritic cells were detected as HLA-DR+, CD14Low/neg, CD11c+.
Abbreviations: APC, antigen-presenting cell; FSC, forward scatter; SSC, side scatter.
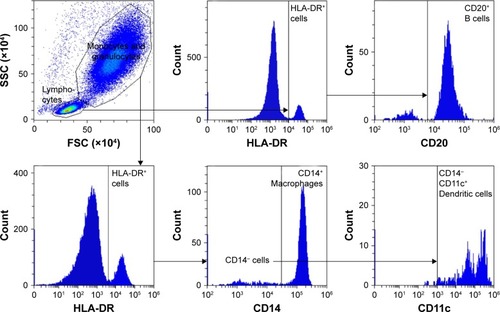
Figure 6 APCs take up OPSS-liposomes.
Notes: Rhodamine-labeled OPSS-liposomes incubated in serum with complement C3 are internalized by APCs, whereas control-liposomes incubated in C3+ serum are not readily internalized. OPSS-liposomes and control-liposomes incubated in serum depleted of complement C3 (C3−) show little uptake into APCs. Data are expressed as mean ± standard error (n=5).
Abbreviations: APC, antigen-presenting cell; OPSS, orthopyridyl disulfide.
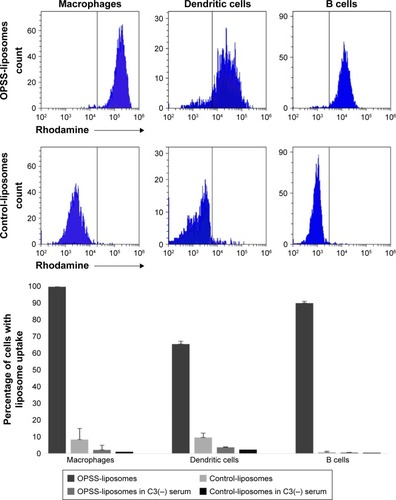
Figure 7 Lymphocyte internalization of liposomes.
Notes: Rhodamine-labeled C3-liposomes are not internalized readily by T-cells or NK cells. B cells show a high degree of internalization of C3-bound OPSS-liposomes, but limited internalization of OPSS-liposomes incubated in C3 depleted serum (C3−). Control-liposomes incubated in C3+ or C3 depleted serum have limited uptake into all lymphocytes. Data are expressed as mean ± standard error (n=5).
Abbreviations: NK, natural killer; OPSS, orthopyridyl disulfide.
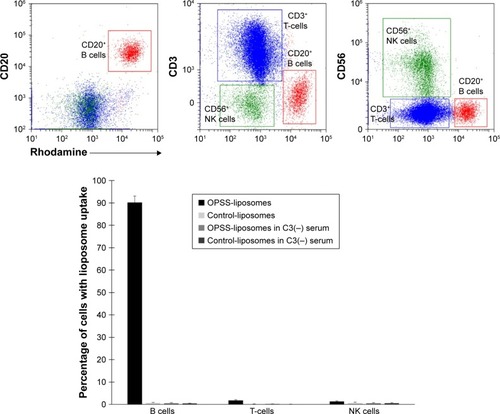
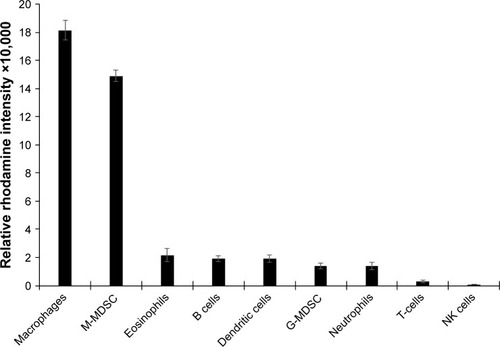
Figure 8 Relative rhodamine fluorescence intensity of white blood cell populations.
Notes: White blood cells were isolated from whole human blood and exposed to rhodamine-labeled C3-liposomes. Cell populations were identified via flow cytometry, and relative rhodamine fluorescence intensities were determined for each cell population. Data are expressed as mean ± standard error (n=5).
Abbreviations: G-MDSC, granulocytic myeloid-derived suppressor cell; M-MDSC, monocytic myeloid-derived suppressor cell; NK, natural killer.