Figures & data
Figure 1 SEM images of N-MWCNTs (A and B) and MWCNTs (C and D): pristine (A and C) and after acid treatment (B and D).
Notes: The N-MWCNTs well aligned with large amounts of iron carbide nanoparticles adhered on their surface (A). After acid treatment, the N-MWCNTs present almost no metallic nanoparticles attached to their outer carbon layer (B and D). The case of MWCNTs is different; few iron carbide nanoparticles are present adhered to their external surface (A and C). The acid treatment of MWCNTs induced serious disruption in their morphology (B and D).
Abbreviations: N-MWCNTs, nitrogen-doped MWCNTs; MWCNTs, multiwalled carbon nanotubes.
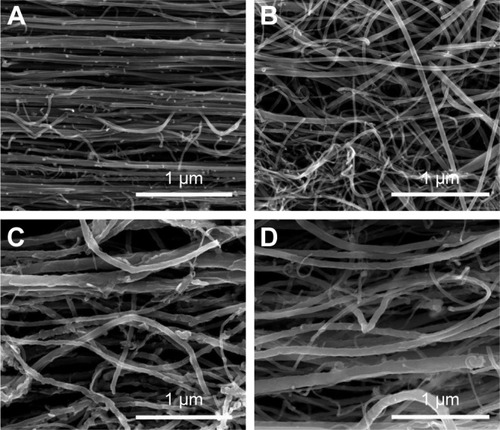
Figure 2 MWCNTs induce cell death in primary cultures of rat astrocytes.
Notes: Astrocytes were treated with different concentrations of MWCNTs. Graph shows mean ± SEM of dead cells in a primary culture of rat astrocytes treated with MWCNTs. Rat astrocytes (1×10⁶) were treated with MWCNTs for 24 h, and the percentage of dead cells was determined by FACS using propidium iodide stain. *P<0.01 vs control and **P<0.001 vs control.
Abbreviations: MWCNT, multiwalled carbon nanotube; N-MWCNT, nitrogen-doped MWCNT; N-MWCNT-ox, acid-treated nitrogen-doped MWCNT; MWCNT-ox, acid-treated MWCNT.
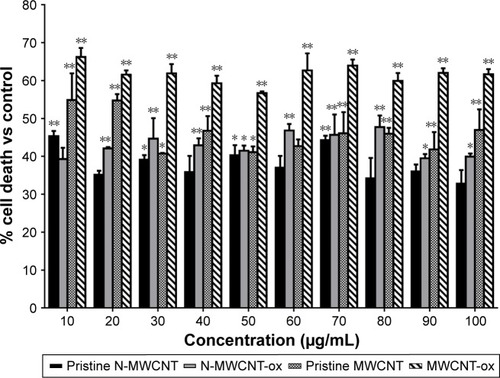
Figure 3 MWCNTs induce cell death in cultures of rat RG2 glioma cells.
Notes: RG2 glioma cells were treated with different concentrations of MWCNTs. Graph shows mean ± SEM of lysis of RG2 glioma cells induced by MWCNTs. Glioma cells (1×10⁶) were treated with different concentrations of MWCNTs for 24 h, and the percentage of dead cells was determined by FACS using propidium iodide stain. *P<0.01 vs control and **P<0.001 vs control.
Abbreviations: MWCNT, multiwalled carbon nanotube; N-MWCNT, nitrogen-doped MWCNT; N-MWCNT-ox, acid-treated nitrogen-doped MWCNT; MWCNT-ox, acid-treated MWCNT.
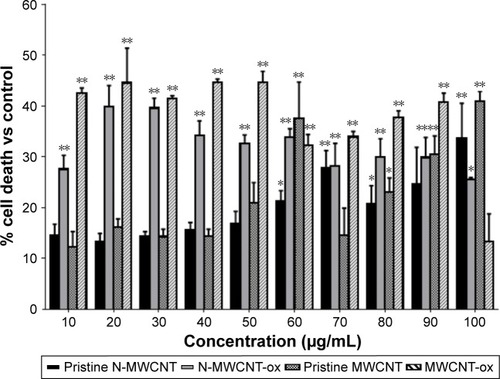
Figure 4 TMZ treatment increases MWCNTs cell death in RG2 glioma cells.
Notes: RG2 glioma cells were treated with 50 µg/mL of MWCNTs, TMZ or MWCNTs plus TMZ. Graph shows mean ± SEM of dead RG2 glioma cells, and representative FACS histograms show the percentage of PI+ cells. Glioma cells (1×10⁶) were treated with different concentrations of MWCNTs, TMZ or TMZ plus MWCNTs for 24 h, and the percentage of dead cells was determined by FACS using propidium iodide stain. *P<0.01 vs control and **P<0.001 vs control.
Abbreviations: TMZ, temozolomide; MWCNT, multiwalled carbon nanotube; N-MWCNT, nitrogen-doped MWCNT; N-MWCNT-ox, acid-treated nitrogen-doped MWCNT; MWCNT-ox, acid-treated MWCNT.
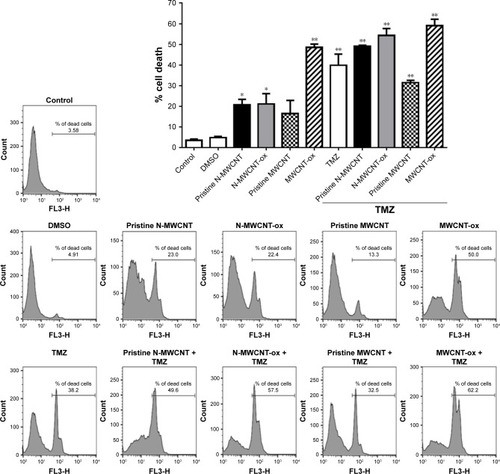
Figure 5 Effect of treatment with MWCNTs and TMZ in RG2 glioma cells.
Notes: MWCNTs are well phagocytosed by RG2 glioma cells (A). TMZ treatment does not affect the capacity of RG2 glioma cells to phagocytose MWCNTs (B). The representative images of RG2 glioma cells by light microscopy and FACS dot plots are shown. The microscopy images show that the cells endocytosed the four different MWCNTs used (A) and MWCNTs used in combination with TMZ, and the first row of dot plots shows the increase in size of the RG2 glioma cells due to the increase in the number of MWCNTs endocytosed. The second line of dot plots shows the representative images of the induction of apoptosis and necrosis by different MWCNTs endocytosed by RG2 cells.
Abbreviations: MWCNT, multiwalled carbon nanotube; TMZ, temozolomide; N-MWCNT, nitrogen-doped MWCNT; N-MWCNT-ox, acid-treated nitrogen-doped MWCNT; MWCNT-ox, acid-treated MWCNT.
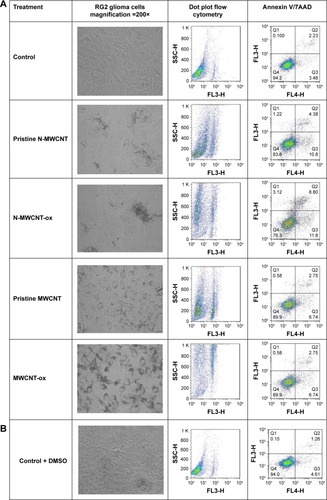
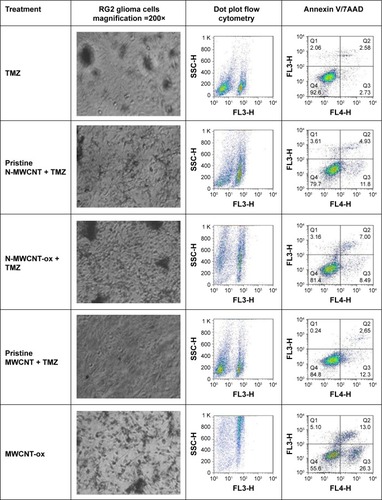
Figure 6 Effect of TMZ or MWCNTs on apoptosis induction in malignant RG2 glioma cells in vitro.
Notes: Tumor cells were seeded at a density of 3×10⁵ cells per well (1 mL) in six-well flat-bottomed plates and incubated overnight at 37°C. After exposure to TMZ (10 mM) and treatments with MWCNTs (50 µg/mL) for 24 h, the cells were trypsinized. Results show the mean ± SEM of three independent experiments of viable cells (A), necrotic cells (B), late apoptosis (C) and apoptosis (D). *P<0.01 vs control and **P<0.001 vs control.
Abbreviations: TMZ, temozolomide; MWCNT, multiwalled carbon nanotube; N-MWCNT, nitrogen-doped MWCNT; N-MWCNT-ox, acid-treated nitrogen-doped MWCNT; MWCNT-ox, acid-treated MWCNT.
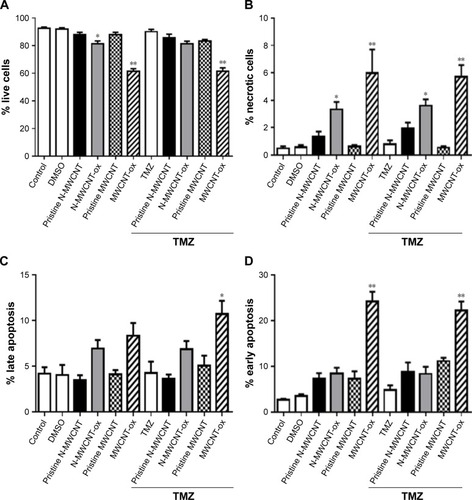
Figure 7 Effect of TMZ or MWCNTs on total apoptosis induction in malignant RG2 glioma cells in vitro.
Notes: Tumor cells were seeded at a density of 3×10⁵ cells per well (1 mL) in six-well flat-bottomed plates and incubated overnight at 37°C. After exposure to TMZ (10 mM) and MWCNTs (50 µg/mL) for 24 h, the cells were trypsinized, and the number of total apoptotic cells was determined by flow cytometry. Results show the mean ± SEM of three independent experiments. **P<0.001 vs control.
Abbreviations: TMZ, temozolomide; MWCNT, multiwalled carbon nanotube; N-MWCNT, nitrogen-doped MWCNT; N-MWCNT-ox, acid-treated nitrogen-doped MWCNT; MWCNT-ox, acid-treated MWCNT.
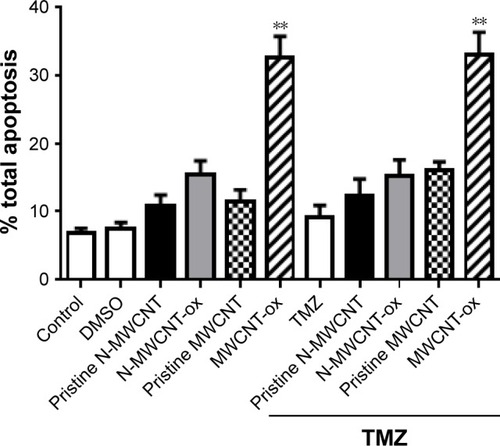
Figure 8 TMZ treatment maximizes the cell cycle arrest by MWCNTs in RG2 glioma cells.
Notes: RG2 glioma cells were treated with 50 µg of MWCNTs, TMZ or MWCNTs plus TMZ. Graphs show mean ± SEM of RG2 glioma cells in sub-G0, G0–G1, S and G2–M cell cycle stage. The percentage of dead cells was determined by FACS using propidium iodide stain. **P<0.001 vs control.
Abbreviations: TMZ, temozolomide; MWCNT, multiwalled carbon nanotube; N-MWCNT, nitrogen-doped MWCNT; N-MWCNT-ox, acid-treated nitrogen-doped MWCNT; MWCNT-ox, acid-treated MWCNT.
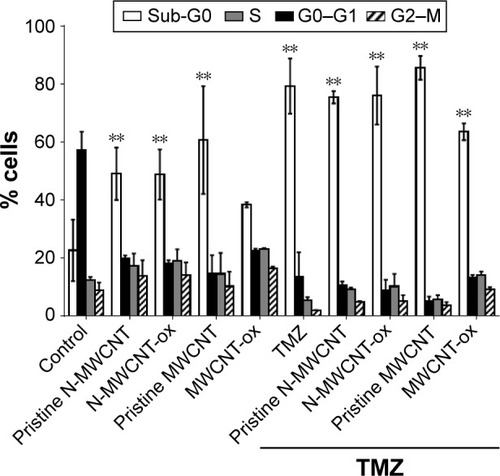
Figure 9 TMZ treatment maximizes the cellular dysfunction by MWCNTs in RG2 glioma cells.
Notes: RG2 glioma cells were treated with 50 µg/mL of MWCNTs, TMZ or MWCNTs plus TMZ. Graph shows mean ± SEM of MTT reduction in RG2 glioma cells. Malignant RG2 glioma cells (1×10⁵) were seeded in 96-well plates in contact with the different types of MWCNTs; after 24 h of treatment, MTT reduction was assessed. *P<0.01 vs control and **P<0.001 vs control.
Abbreviations: TMZ, temozolomide; MWCNT, multiwalled carbon nanotube; N-MWCNT, nitrogen-doped MWCNT; N-MWCNT-ox, acid-treated nitrogen-doped MWCNT; MWCNT-ox, acid-treated MWCNT.
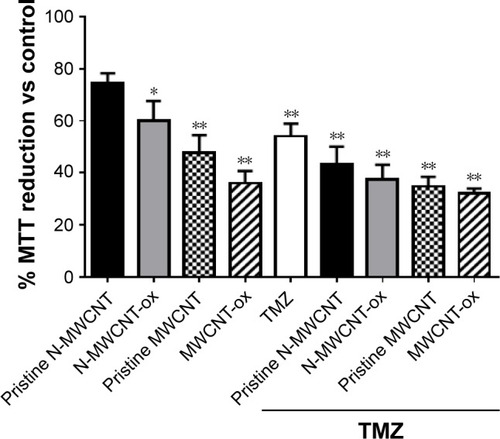
Figure 10 ROS production induced by MWCNTs.
Notes: RG2 glioma cells were treated with 50 µg/mL of MWCNTs, TMZ or MWCNTs plus TMZ. Graph shows mean ± SEM of ROS production. Malignant RG2 glioma cells (1×10⁶) were seeded in six-well plates in contact with the different CNTs; after 30, 60, 180 and 360 min, ROS production was assessed. No significant changes were seen between treatments.
Abbreviations: ROS, reactive oxygen species; MWCNT, multiwalled carbon nanotube; TMZ, temozolomide; CNTs, carbon nanotubes; N-MWCNT, nitrogen-doped MWCNT; N-MWCNT-ox, acid-treated nitrogen-doped MWCNT; MWCNT-ox, acid-treated MWCNT.
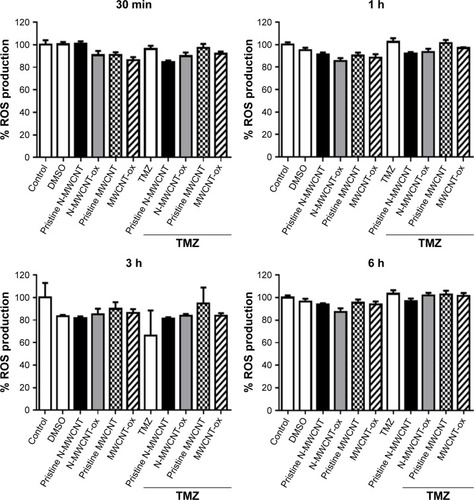
Figure 11 Intracellular ROS production induced by MWCNTs.
Notes: RG2 glioma cells were treated with 50 µg/mL of MWCNTs, TMZ or MWCNTs plus TMZ. Graph shows mean ± SEM of intracellular ROS production by glioma cells. RG2 glioma cells (1×10⁶) were seeded in six-well plates for treatment; after 60 min, intracellular ROS production was assessed by FACS. No significant changes were seen between treatments.
Abbreviations: ROS, reactive oxygen species; MWCNT, multiwalled carbon nanotube; TMZ, temozolomide; N-MWCNT, nitrogen-doped MWCNT; N-MWCNT-ox, acid-treated nitrogen-doped MWCNT; MWCNT-ox, acid-treated MWCNT.
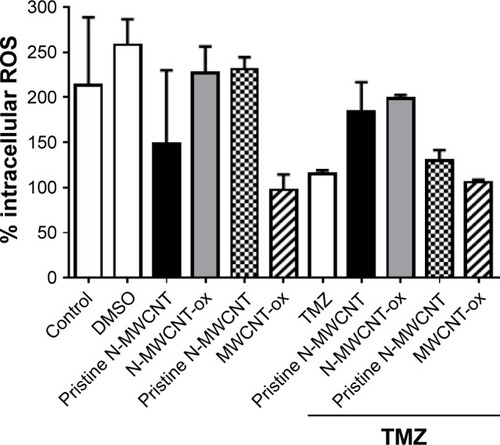
Figure 12 TMZ treatment increases MWCNTs-induced mitochondrial dysfunction in RG2 glioma cells.
Notes: RG2 glioma cells were treated with 50 µg/mL of MWCNTs, TMZ or MWCNTs plus TMZ. Graph shows the MFI ± SEM in RG2 glioma cells. RG2 glioma cells (1×10⁶) were seeded in six-well plates for the different treatments; after 24 h of treatment, mitochondrial membrane potential (ΔΨm) was determined by FACS. *P<0.01 vs control and **P<0.001 vs control.
Abbreviations: TMZ, temozolomide; MWCNT, multiwalled carbon nanotube; MFI, mean fluorescence intensity; N-MWCNT, nitrogen-doped MWCNT; N-MWCNT-ox, acid-treated nitrogen-doped MWCNT; MWCNT-ox, acid-treated MWCNT.
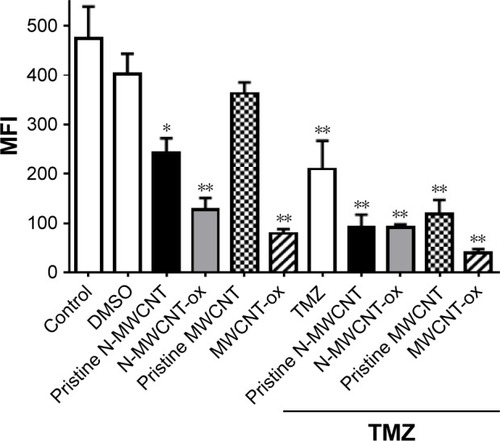
Figure 13 Effect of TMZ or MWCNTs on autophagy induction in malignant RG2 glioma cells.
Notes: Tumor cells were seeded at a density of 1×10⁶ cells per well (1 mL) in six-well flat-bottomed plates and incubated overnight at 37°C. After exposure to TMZ (10 mM) and MWCNTs (50 µg/mL) for 24 h, the cells were trypsinized, and the percentage of LC3+ cells was measured by flow cytometry. The figure shows the means ± SEM of three independent experiments.
Abbreviations: TMZ, temozolomide; MWCNT, multiwalled carbon nanotube; MFI, mean fluorescence intensity; N-MWCNT, nitrogen-doped MWCNT; N-MWCNT-ox, acid-treated nitrogen-doped MWCNT; MWCNT-ox, acid-treated MWCNT.
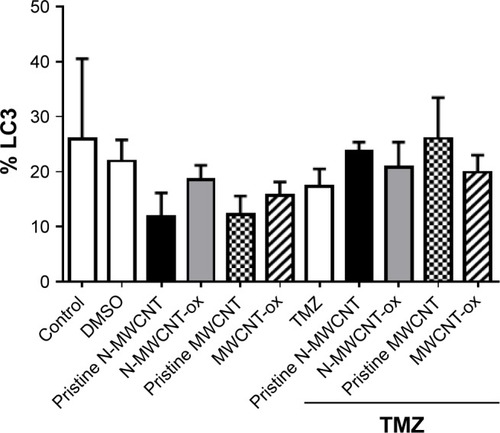
Figure 14 Histological sections of healthy rat brain and tumoral tissue from the left side of brain after intratumoral injection of MWCNTs (magnification 200×).
Notes: No signs of inflammation by mononuclear cell infiltration were seen in all treated tissues. MWCNTs were more concentrated in healthy brain compared with tumoral tissue.
Abbreviations: MWCNT, multiwalled carbon nanotube; N-MWCNT, nitrogen-doped MWCNT; N-MWCNT-ox, acid-treated nitrogen-doped MWCNT; MWCNT-ox, acid-treated MWCNT.
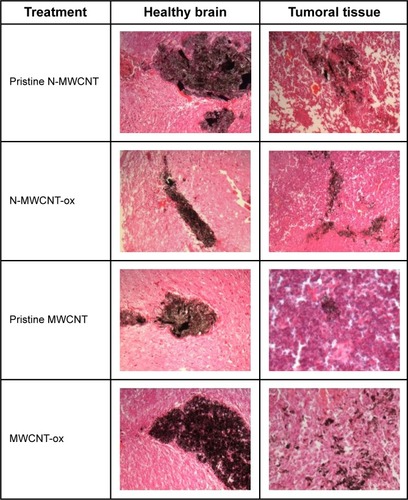
Figure 15 Kaplan–Meier survival plot of rats bearing intracranial RG2 glioma after intratumoral administration of different MWCNTs (50 µg/10 µL at day 2 post-implant).
Notes: Prolonged survival was seen in rats bearing intracranial RG2 glioma treated with N-MWCNT-ox. The figure shows the survival curves and Kaplan–Meier survival analysis of rats implanted with RG2 (1×10⁶ cells/rat) and treated with MWCNTs (n=10).
Abbreviations: MWCNT, multiwalled carbon nanotube; N-MWCNT-ox, acid-treated nitrogen-doped MWCNT; N-MWCNT, nitrogen-doped MWCNT; MWCNT-ox, acid-treated MWCNT.
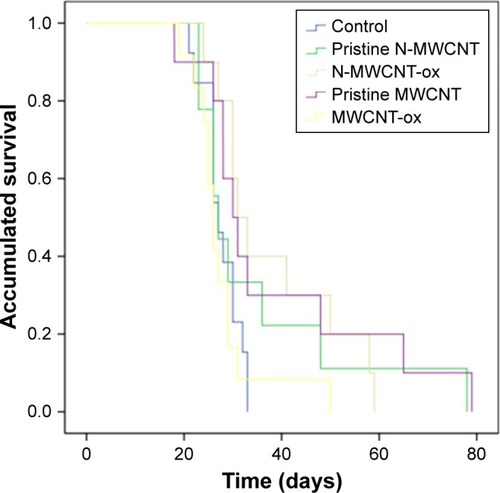
Figure S1 TEM images of typical N-MWCNTs before (A and B) and after (C and D) acid treatment.
Notes: Most particles attached to the nanotubes surface were eliminated with the acid treatment. Note in (D) a small protuberance that possibly contained a metallic nanoparticle (arrow).
Abbreviations: TEM, transmission electron microscopy; N-MWCNTs, nitrogen-doped multiwalled carbon nanotubes.
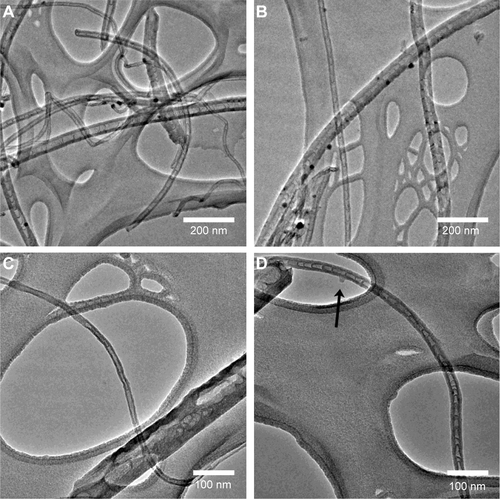
Figure S2 TEM images of typical MWCNTs (undoped) before (A and B) and after (C and D) acid treatment.
Notes: Most of the metallic nanoparticles are inside the pristine carbon nanotubes (A and B). Besides the elimination of such nanoparticles, acid treatments provoked severe damages on the MWCNTs surface (C and D). The arrows show the damage provoked by the acid treatment in the MWCNTs surface.
Abbreviations: TEM, transmission electron microscopy; MWCNTs, multiwalled carbon nanotubes.
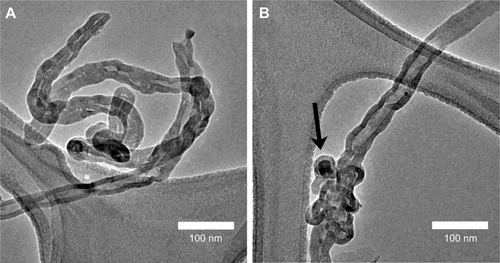
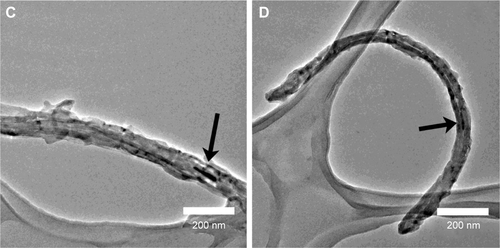
Figure S3 HRTEM images showing the morphological aspects of different CNTs used in this study.
Notes: A pristine N-MWCNT of ~46-nm diameter showing typical compartments of bamboo-like shape of nanotubes (A). A functionalized N-MWCNT showing surface damage probably provoked by the acid treatment; the loss of diameter uniformity is also perceptible (B). A pristine MWCNT having an internal iron carbide nanoparticle; the diameter of this carbon nanotube is ~60 nm (C). An MWCNT with acid treatment; although in this case the internal nanoparticle did not suffer damage because the lateral cavities were blocked, the surface was damaged by the acid treatment (D).
Abbreviations: HRTEM, high-resolution transmission electron microscopy; CNTs, carbon nanotubes; N-MWCNT, nitrogen-doped MWCNT; MWCNT, multiwalled carbon nanotube.
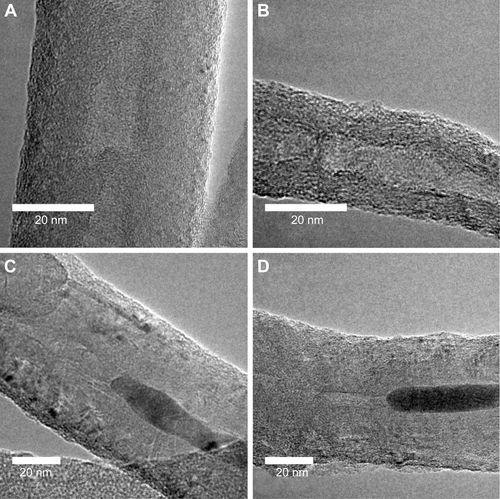
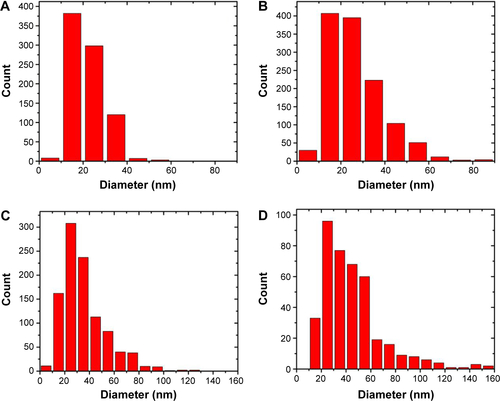
Figure S4 Column plots showing diameter distribution corresponding to each kind of CNTs studied in this work.
Notes: Pristine N-MWCNTs exhibit an average diameter of 22.2 nm. In this case, the minimum diameter found was ~7 nm, and the maximum was ~60 nm (A). Acid-treated N-MWCNTs where the minimum diameter found was 5.8 nm and the maximum was 87 nm with an average of 26.4 nm (B). Pristine MWCNTs with diameters ranging between 7 and 129 nm, and an average diameter of 35.3 nm (C). Acid-treated MWCNTs present an average diameter of 44 nm, a minimum diameter of 13 nm and a maximum diameter of 154 nm (D). These results may seem contradictory because the amount of acid-treated CNTs with a broad diameter increased. However, it is possible that thick nanotubes could break due to the influence of the acid, increasing the amount of large-diameter CNTs.
Abbreviations: CNTs, carbon nanotubes; N-MWCNTs, nitrogen-doped MWCNTs; MWCNT, multiwalled carbon nanotube.