Figures & data
Figure 1 Structure analysis of marker-MNPs.
Notes: (A) Structural diagram of naked nanobeads. (B) Structural diagram of marker-MNPs. Red fonts indicate restriction sites of FAPα. (C) Fluorescence spectra of marker-MNPs conjugated with fluorescein-labeled peptides and naked beads incubated with an equivalent amount of free fluorescein-labeled peptides (excitation: 492 nm; emission: 500–700 nm; quenching efficiency =90.8%). (D) Fluorescent image of fluorescence quenching. (E) Average fluorescence of marker-MNPs incubated in 10% mouse serum at 37°C over time (excitation: 492 nm; emission: 518 nm). (F) Average fluorescence of marker-MNPs incubated in urine of mice at 37°C over time.
Abbreviations: MNPs, magnetic iron oxide nanoparticles; RFU, relative fluorescence unit.
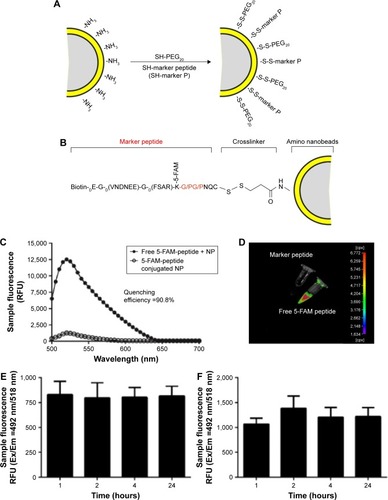
Figure 2 Schematic and design of the approach.
Notes: Marker-MNPs composed of nanobeads conjugated with an FAPα-sensitive substrate in tandem with a ligand-encoded reporter. These agents survey the vasculature for the sites where FAPα cleaves and releases the reporters into urine for analysis by ELISA.
Abbreviations: ELISA, enzyme-linked immunosorbent assay; FAPα, fibroblast activation protein α; MNPs, magnetic iron oxide nanoparticles.
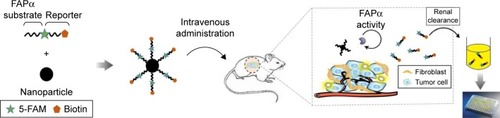
Figure 3 Schematic of urine reporter detection.
Notes: (A) Schematic of ligand-encoded reporter along with chemical structures of associated ligands. (B) Schematic of ELISA sandwich complex. (C) Reporter concentration (R, Rc + R) in urine was detected with anti-FAM antibody by ELISA. (D) Control peptide concentration (Rc) in urine was detected with anti-AF488 antibody by ELISA.
Abbreviations: ELISA, enzyme-linked immunosorbent assay; HRP, horseradish peroxidase; OD, optical density, R, reporter; Rc, reporter control peptide.
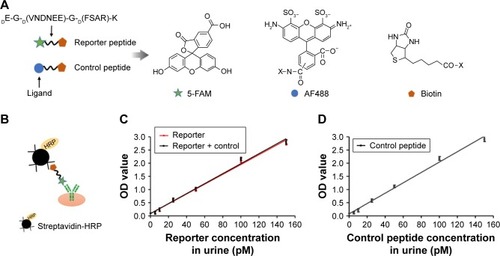
Figure 4 Identification of physicochemical properties of marker-MNPs in vitro.
Notes: (A) Quantification of the level of cleaved reporters released from marker-MNPs after incubation with increasing concentrations of FAPα (n=3 per dose, x ± SD). (B) Marker-MNPs incubated with FAPα enzyme (10 nM) or with FAPα enzyme (10 nM) with Talabostat (1 nM). (C) Verification of FAPα, DPP4, MMP2 expression levels in 3T3/FAP, 3T3, PC3 cell lines by Western blotting. (D) Cleaved reporter concentration in the supernatant detected by ELISA after incubation with different cell lysates. (E) Sample fluorescence analysis after incubation with different cell lysates.
Abbreviations: DPP4, Dipeptidyl peptidase-4; ELISA, enzyme-linked immunosorbent assay; FAPα, fibroblast activation protein α; MMP2, matrix metalloproteinase 2; MNPs, magnetic iron oxide nanoparticles; RFU, relative fluorescence unit.
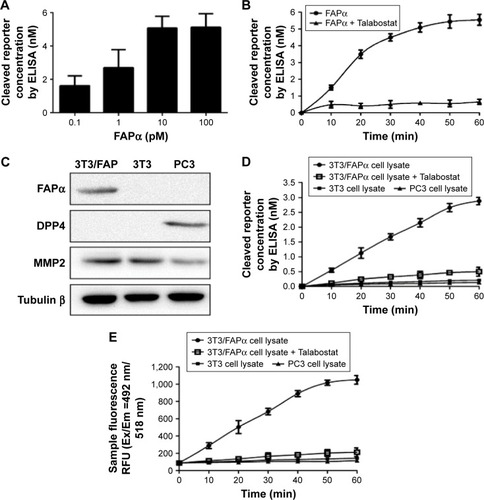
Figure 5 Urinary diagnosis of solid tumor by marker-MNPs.
Notes: Two doses, that is, (A–C) 100 nM and (E–G) 10 nM of marker-MNPs were co-injected with the reporter control into Eca109 tumor-bearing mice and healthy control mice and urinary reporters (R or Rc) were measured by ELISA. (D, H) ROC curve was plotted to distinguish ESCC tumor mice from healthy mice.
Abbreviations: ROC, receiver-operating characteristic; ELISA, enzyme-linked immunosorbent assay; ESCC, esophageal squamous cell carcinoma; MNPs, magnetic iron oxide nanoparticles.
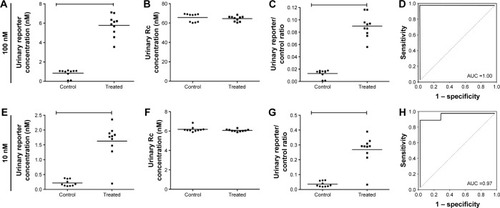
Figure 6 Detection of FAPα enzyme in vivo. Marker-MNPs (100 μL in PBS, 100 nM by peptide) were injected into Eca109 tumor-bearing mice (treated group) or healthy mice (control group) via tail vein.
Notes: (A) In vivo fluorescence images of healthy mice and Eca109 tumor-bearing mice injected i.v. with marker-MNPs. Images were acquired at 1 hour after injection and were normalized by the maximum average value. The color bar indicates radiant efficiency (low, 0; high, 0.15×10⁵). (B) Representative images of dissected organs and tissues of healthy mice (upper row) and Eca109 tumor-bearing mice (lower row) sacrificed at 6 hours after injected i.v. with marker-MNPs. The color bar indicates radiant efficiency (low, 0; high, 0.13×10⁵). (C) Relative quantification of the fluorescent signal of organs after the mice were infused with mixtures of marker-MNPs (Student’s t-test; n=8 mice, SD). (D) Immunofluorescence images of tumor sections injected with marker-MNPs (red; a, b). Tumor sections were counterstained with DAPI (blue; c, d). Analysis of expression of FAPα in Eca109 tumor section by immunohistochemistry.
Abbreviations: DAPI, 4′,6-diamidino-2-phenylindole; FAPα, fibroblast activation protein α; i.v., intravenously; MNPs, magnetic iron oxide nanoparticles.
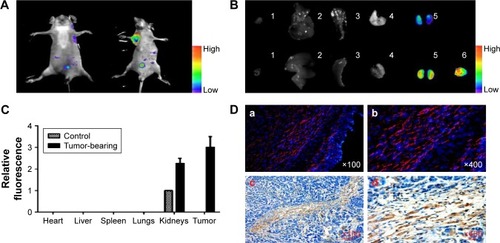
Figure S1 Structures and characterization of peptide-conjugated synthetic nanoprobes.
Notes: (A) Structures of peptide-conjugated synthetic nanoprobes. Red fonts indicate restriction sites of FAPα. (B) TEM images of the magnetic iron oxide beads (MNPs). (C) Size distribution of the MNPs after conjunction. (D, E) MS and HPLC identification of synthetic substrate peptide of FAPα.
Abbreviations: FAPα, fibroblast activation protein α; HPLC, high-performance liquid chromatography; MNPs, magnetic iron oxide nanoparticles; MS, mass spectroscopy; TEM, transmission electron microscopy.
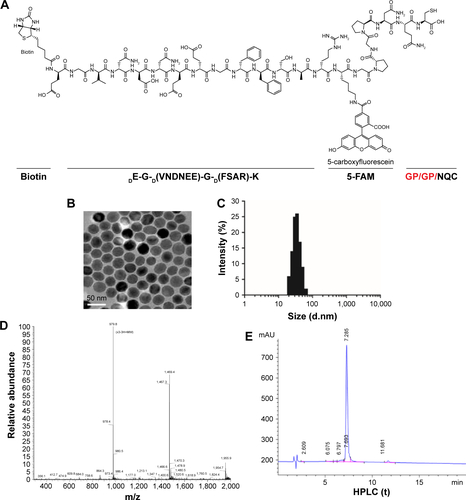
Figure S2 Identification of 3T3/FAPα cell line and renal clearance of reporter peptides.
Notes: (A) Photo of 3T3 cell (left) and 3T3/FAPα cell successfully transferred fluorescence plasmid expressing FAPα and TdTomato fluorescent protein (right). (B) Renal clearance of reporter peptide and reporter peptide control. Serial dilutions of reporter peptide (a) and control peptide (b) were injected into healthy mice via tail vein. Concentration of reporter peptide or control peptide in urine was detected by ELISA. Magnification ×200.
Abbreviations: ELISA, enzyme-linked immunosorbent assay; FAPα, fibroblast activation protein α.
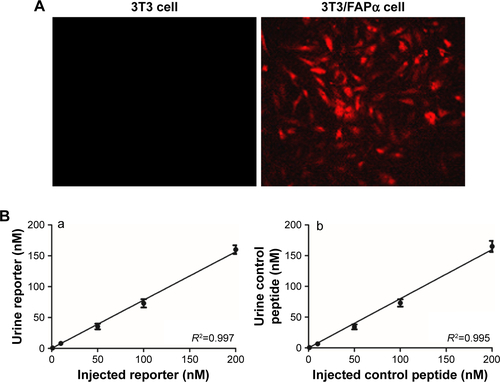
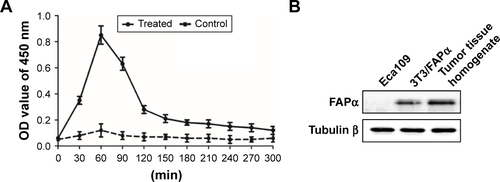
Figure S3 Elisa and Western blot results of detection of FAPα enzyme in vivo.
Notes: (A) Synthetic nanoprobe (100 μL in PBS, 100 nM by peptide) was injected into Eca109 tumor-bearing mice (treated group) or healthy mice (control group) via tail vein. Figure shows changes in reporters’ concentration in the urine of two groups of animals within 300 min. (B) Western blotting analysis of FAPα expression in Eca109 cells, 3T3/FAPα cells and tumor tissue homogenate from xenograft tumor mice models.
Abbreviation: FAPα, fibroblast activation protein α.