Figures & data
Table 1 Independent variables and levels of experiment design
Table 2 Analysis of variance of the regression coefficients of the quadratic equations
Figure 1 Three-dimensional response surface plots for EE and DL.
Notes: (A) Response surface plot showing the effect of the amount of PUE (X1) and Tween®80 (X4) on the EE and DL of PUE (EE1, DL1). (B) Response surface plot showing the effect of the amount of SCU (X2), Tween®80 (X4), and SCU (X2), lecithin/cholesterol (X3) on the EE of SCU (EE2).
Abbreviations: PUE, puerarin; SCU, scutellarin; EE, entrapment efficiency; DL, drug loading.
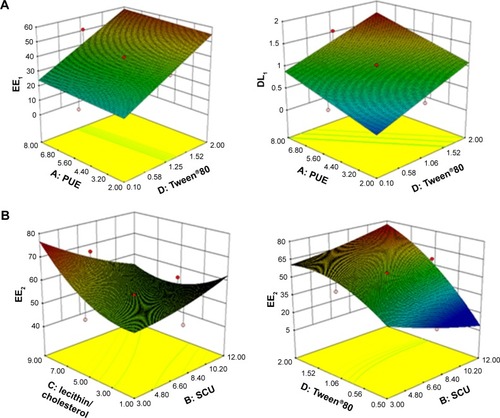
Figure 2 (A) Particle size distribution, (B) zeta potential distribution, and (C) transmission electron micrograph.
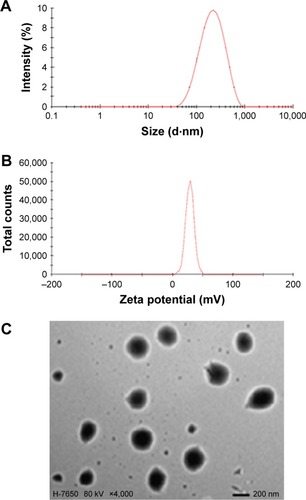
Figure 3 In vitro release profiles of PUE and SCU from PUE-SCU CLN formulations (n=3).
Abbreviations: PUE, puerarin; SCU, scutellarin; CLN, cationic lipid nanoparticle.
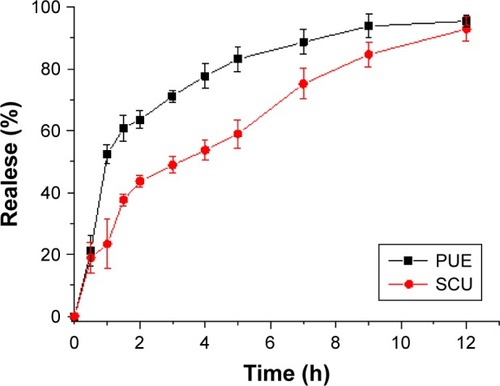
Figure 4 Fluorescence images of rabbit eyes after administration (M1: corneal surface; M2: inner canthus and nasolacrimal duct region).
Notes: (A) RhB solution; (B) RhB-CLNs.
Abbreviations: CLNs, cationic lipid nanoparticles; RhB, rhodamine B.
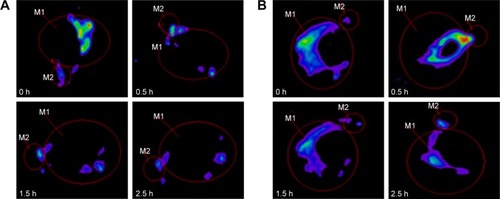
Table 3 Pharmacokinetic parameters of PUE in aqueous humor after topical administration in the conscious rabbits
Table 4 Pharmacokinetic parameters of SCU in aqueous humor after topical administration in the conscious rabbits
Figure 5 PUE and SCU concentration–time profiles following a 200-μL topical administration at a dose of 2.0 mg·mL−1 in the aqueous humor (n=3).
Notes: (A) PUE; (B) SCU.
Abbreviations: PUE, puerarin; SCU, scutellarin.
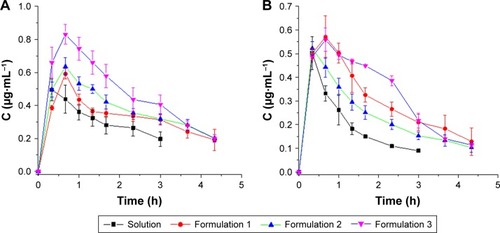
Figure 6 (A, B) Free energy profiles of PUE and SCU passing across POPC bilayer. (C, D) The final structure of PUE at the lowest and highest energies. (E, F) The final structure of SCU at the highest and lowest energies.
Abbreviations: PUE, puerarin; SCU, scutellarin.
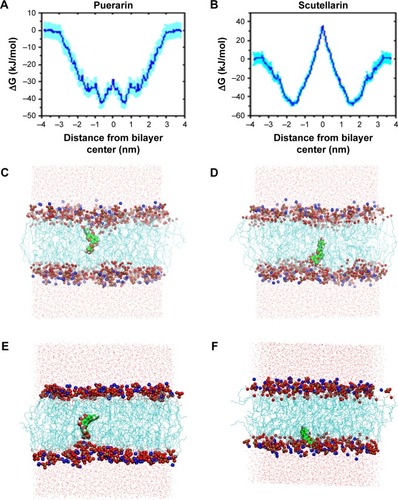
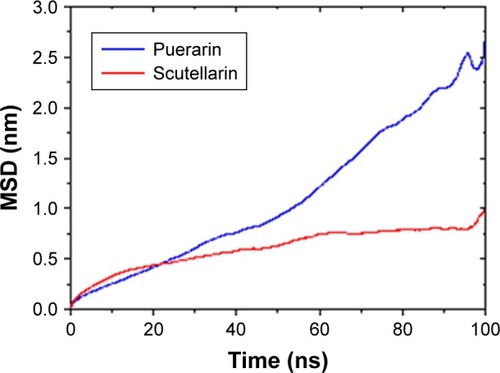
Figure 7 The MSD of PUE and SCU at 100 ns.
Abbreviations: PUE, puerarin; SCU, scutellarin; MSD, mean square deviation.