Figures & data
Figure 1 Reaction scheme for synthesis of the drug carrier polymer (I), DTX precursor (II), and conjugate drug, Polytaxel (III).
Note: The numbers in parentheses are the identification numbers for compounds.
Abbreviations: AA, aconitic acid; Boc, tert-Butoxycarbonyl; DIC, diisoproplycarbodiimide; DIPEA, N-ethyldiisoproplyamine; DPTS, 4-(dimethylamino)pyridine 4-toluenesulfonate; DTX, docetaxel; Et3N, triethyl amine; Lys, lysine; MPEG, methoxy poly(ethylene glycol); OEt, ethylester; RT, room temperature; TFA, trifluoroacetic acid; THF, tetrahydrofuran.
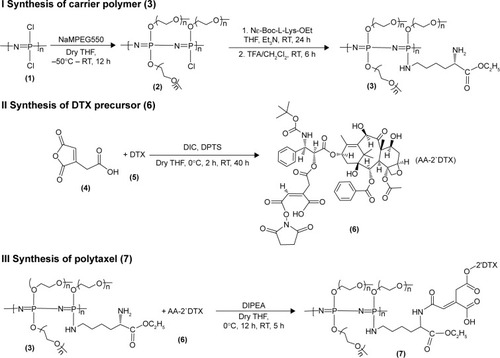
Figure 2 The particle size distributions of the polyphosphazene carrier polymer [NP(MPEG550)3(Lys-OEt)]n (A) and its DTX conjugate Polytaxel (B), as well as the TEM image of Polytaxel in aqueous solution (C) and the CMC value measured by the pyrene fluorescence method (D).
Abbreviations: CMC, critical micelle concentration; DTX, docetaxel; III338/I333, ratio of fluorescence intensities measured at 338 nm and 333 nm; Lys-OEt, lysine ethylester; MPEG, methoxy poly(ethylene glycol); NP, polyphosphazene backbone; TEM, transmission electron microscopy.
![Figure 2 The particle size distributions of the polyphosphazene carrier polymer [NP(MPEG550)3(Lys-OEt)]n (A) and its DTX conjugate Polytaxel (B), as well as the TEM image of Polytaxel in aqueous solution (C) and the CMC value measured by the pyrene fluorescence method (D).Abbreviations: CMC, critical micelle concentration; DTX, docetaxel; III338/I333, ratio of fluorescence intensities measured at 338 nm and 333 nm; Lys-OEt, lysine ethylester; MPEG, methoxy poly(ethylene glycol); NP, polyphosphazene backbone; TEM, transmission electron microscopy.](/cms/asset/84aec334-b99d-40f5-8d23-be0bc65d005a/dijn_a_12193704_f0002_c.jpg)
Figure 3 Mean plasma concentration–time profiles of docetaxel after intravenous injection of Taxotere® (●) or Polytaxel (▲) at a dose of 5 mg/kg in rats.
Note: Bars represent the standard deviation (n=5).
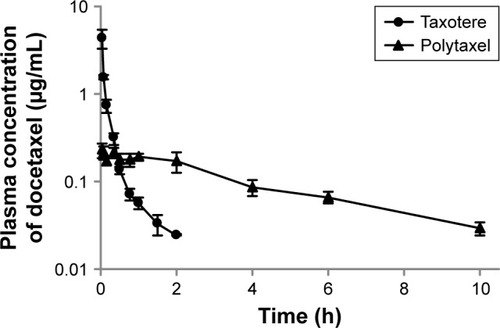
Table 1 PK parameters of docetaxel after intravenous injection of Polytaxel and Taxotere® at a dose of 5 mg/kg in rats
Figure 4 Time-dependent organ distribution of Cy-Polytaxel in the A549 tumor bearing mice.
Note: Fluorescence images of major organs and tumor (A) and plasma (B), harvested from the tumor-bearing mice from 12 to 96 h postinjection.
Abbreviation: Cy, cyanine dye.
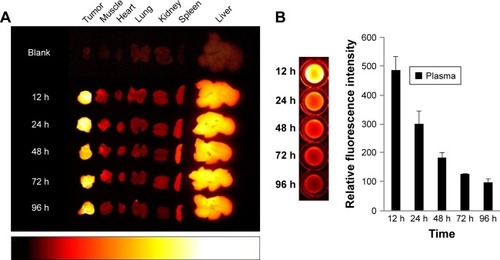
Figure 5 The quantitative fluorescence intensities of Cy-Polytaxel distributed in each major organ of the A549 tumor-bearing mice (A) and TTR (B).
Note: Bars represent standard deviation (n=3).
Abbreviations: Cy, Cyanine dye; TTR, tumor-to-normal tissue ratio.
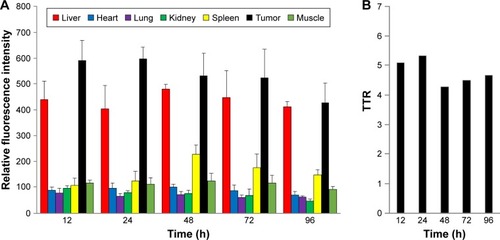
Figure 6 Time-dependent amount of docetaxel in major organs and tumor, quantified by LC-MS/MS.
Note: Bars represent standard deviation (n=3).
Abbreviation: LC-MS/MS, liquid chromatography tandem mass spectrometry.
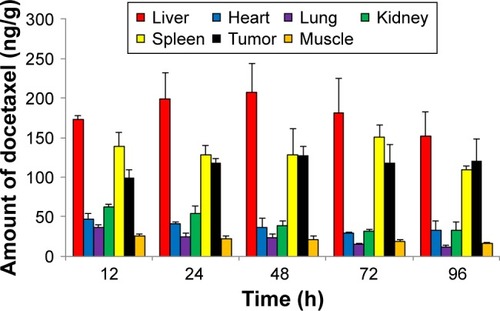
Figure 7 The time-dependent clearance rates of Polytaxel from major organs and tumor after its injection, in terms of fluorescence intensity.
Note: Bars represent standard deviation (n=2).
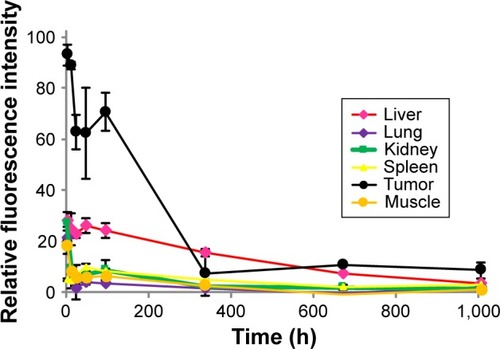
Figure 8 In vitro release profiles of DTX from Polytaxel in acidic (pH 5.4) and neutral (pH 7.4) buffer solutions at 37°C.
Abbreviation: DTX, docetaxel.
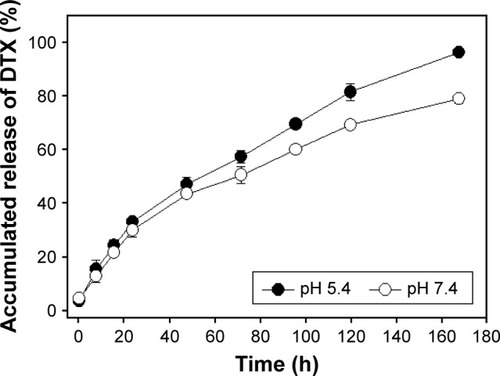
Figure 9 The results of in vivo study of the antitumor efficacy of Taxotere® and Polytaxel against the gastric tumor cell line MKN-28.
Notes: Polytaxel was injected at doses of 10 and 20 mg/kg based on docetaxel content. Bars represent standard deviation (n=5).
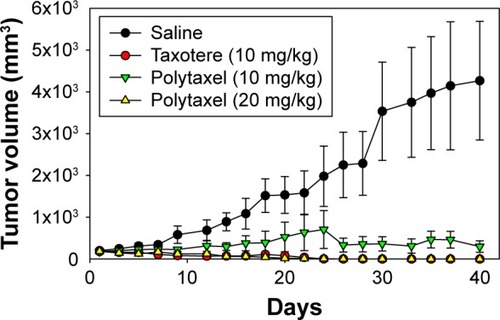
Figure S1 1H-NMR spectra of the polyphosphazene carrier polymer [NP(MPEG550)3(Lys-OEt)]n (A) and its conjugate, Polytaxel [NP(MPEG550)3(Lys-OEt)(AA) (DTX)]n (B).
Abbreviations: AA, aconitic acid; DTX, docetaxel; Lys-OEt, lysine ethylester; MPEG, methoxy poly(ethylene glycol); NMR, nuclear magnetic resonance; NP, polyphosphazene backbone.
![Figure S1 1H-NMR spectra of the polyphosphazene carrier polymer [NP(MPEG550)3(Lys-OEt)]n (A) and its conjugate, Polytaxel [NP(MPEG550)3(Lys-OEt)(AA) (DTX)]n (B).Abbreviations: AA, aconitic acid; DTX, docetaxel; Lys-OEt, lysine ethylester; MPEG, methoxy poly(ethylene glycol); NMR, nuclear magnetic resonance; NP, polyphosphazene backbone.](/cms/asset/a986fa15-ea82-4cf6-8cfa-0983ac2717ca/dijn_a_12193704_sf0001_b.jpg)
Figure S2 31P-NMR spectrum of polyphosphazene carrier polymer [NP(MPEG550)3(Lys-OEt)]n (A) and its Polytaxel conjugate [NP(MPEG550)3(Lys-OEt)(AA)(DTX)]n (B).
Abbreviations: AA, aconitic acid; DTX, docetaxel; Lys-OEt, lysine ethylester; MPEG, methoxy poly(ethylene glycol); NMR, nuclear magnetic resonance; NP, polyphosphazene backbone.
![Figure S2 31P-NMR spectrum of polyphosphazene carrier polymer [NP(MPEG550)3(Lys-OEt)]n (A) and its Polytaxel conjugate [NP(MPEG550)3(Lys-OEt)(AA)(DTX)]n (B).Abbreviations: AA, aconitic acid; DTX, docetaxel; Lys-OEt, lysine ethylester; MPEG, methoxy poly(ethylene glycol); NMR, nuclear magnetic resonance; NP, polyphosphazene backbone.](/cms/asset/ff98c972-2d34-4a61-a7b0-807439316dd6/dijn_a_12193704_sf0002_b.jpg)
Figure S3 Conceptual diagram for the self-assembly of Polytaxel into polymeric micelles.
Abbreviations: AA, aconitic acid; DTX, docetaxel; Lys-OEt, lysine ethylester; MPEG, methoxy poly(ethylene glycol); NP, polyphosphazene backbone.
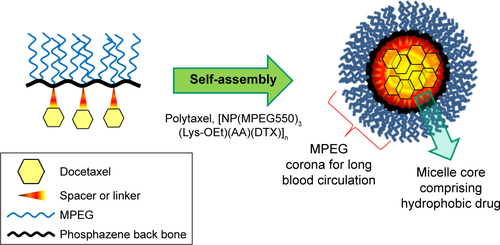
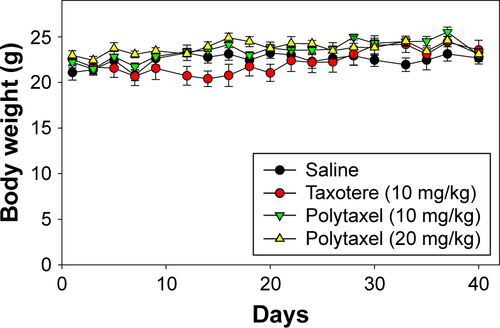
Figure S4 Changes in body weight of nude mice treated with Taxotere® and Polytaxel.
Note: Bars represent standard deviation (n=5).