Figures & data
Figure 1 Characteristics of HAPs.
Notes: TEM micrographs of np20 (A1) and np80 (A2). FTIR patterns (B) and XRD patterns (C).
Abbreviations: FITC, fluorescein isothiocyanate; FTIR, Fourier transform infrared; HAP, hydroxyapatite; m-HAP, micro-sized HAP particles; TEM, transmission electron microscopy; XRD, X-ray diffraction.
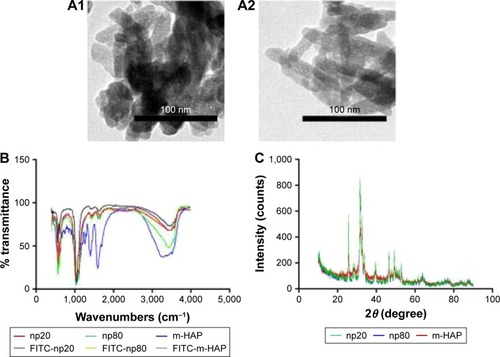
Table 1 Characterization of the particle parameters of HANPs
Figure 2 Effects of HAPs on cell viability and apoptosis.
Notes: The viability of HUVECs cultured with np20 (A1), np80 (A2) and m-HAP (A3) for 24 and 72 h. A subpopulation of necrotic (B) and apoptotic cells (C) following HAP treatment for 24 h. *P<0.05; **P<0.01 versus control. Cells without HAP treatment were set as the control group.
Abbreviations: HAP, hydroxyapatite; HUVECs, human umbilical vein endothelial cells; m-HAP, micro-sized HAP particles.
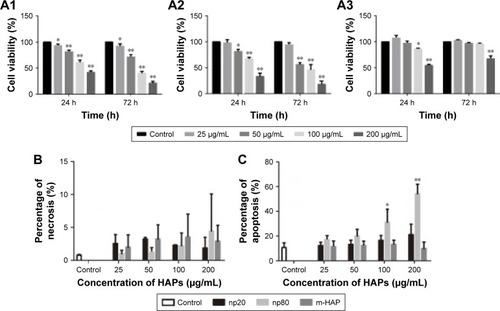
Figure 3 TEM micrographs of internalization and intracellular distribution of HANPs in HUVECs exposed for 1, 2 and 4 h.
Notes: HUVECs without any treatment (A1, A5, B1 and B5); HUVECs treated with np20 (A2–A4 and A6–A8) and np80 (B2–B4 and B6–B8). Overall cell morphology (A1–A4 and B1–B4), scale bar: 2 μm. Higher magnification of cells in red boxed areas (A5–A8 and B5–B8). Scale bar: 500 nm.
Abbreviations: N, nucleus; cc, condensed chromatin; HANPs, hydroxyapatite nanoparticles; HUVECs, human umbilical vein endothelial cells; ms, mitochondrial swelling; nd, nucleus deformation; TEM, transmission electron microscopy.
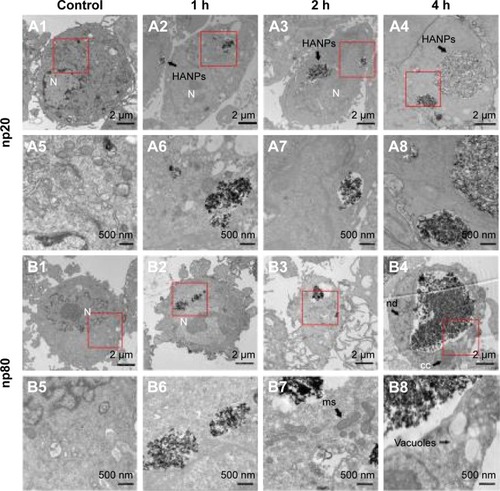
Figure 4 CLSM micrographs of internalization and subcellular distribution of HAPs in HUVECs exposed for 1, 2 and 4 h.
Notes: Cells stained for nuclei (blue) and actin (red). HAPs are shown in green. Scale bar: 50 μm.
Abbreviations: CLSM, confocal laser scanning microscopy; HAP, hydroxyapatite; HUVECs, human umbilical vein endothelial cells; m-HAP, micro-sized HAP particles.
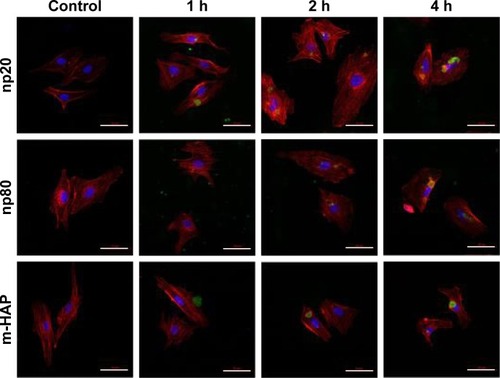
Figure 5 Kinetics of HAPs’ adhesion and uptake.
Notes: Kinetics of adhesion of HAPs onto HUVECs (A). Kinetics of uptake of HAPs by HUVECs (B).
Abbreviations: HAP, hydroxyapatite; HUVECs, human umbilical vein endothelial cells; m-HAP, micro-sized HAP particles.
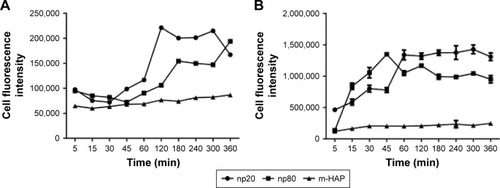
Figure 6 The role of different endocytic pathways in the uptake of HAPs in HUVECs.
Notes: Cells were exposed to HAPs either with or without cpz, mβcd and cytoD. (A) CLSM images of HAP interactions with HUVECs for 2 h. Cells stained for nuclei (blue) and actin (red). HAPs are shown in green. Scale bar: 50 μm. (B) Quantification of the uptake of HAPs after HUVECs were treated with HAPs for 2 h. *P<0.01 versus no inhibitor control, &P<0.01 versus m-HAP group, #P<0.01 versus np20 group.
Abbreviations: CLSM, confocal laser scanning microscopy; cpz, chlorpromazine; cytoD, cytochalasin D; HAP, hydroxyapatite; HUVECs, human umbilical vein endothelial cells; mβcd, methyl-β-cyclodextrin; m-HAP, micro-sized HAP particles.
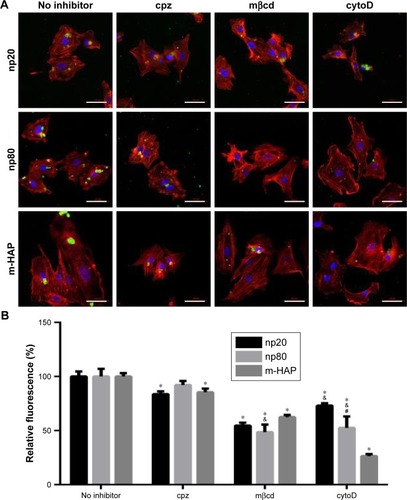
Figure 7 Effects of HAPs on HUVEC function.
Notes: (A and B) Images and quantification of migrated cells treated with HAPs in Transwell plates for 12 h. (C) VEGF secretion of HUVECs cultured with HAPs for 24 h. (D and E) Micrographs and quantification of tube-forming activity in HUVECs cultured with HAPs for 8 h. Cells without HAP treatment were used as the control group. *P<0.05 versus control; **P<0.01 versus control; #P<0.01 versus np20 group; ##P<0.05 versus np20 group; &P<0.05 versus m-HAP group; &&P<0.01 versus m-HAP group.
Abbreviations: HAP, hydroxyapatite; HUVECs, human umbilical vein endothelial cells; m-HAP, micro-sized HAP particles.
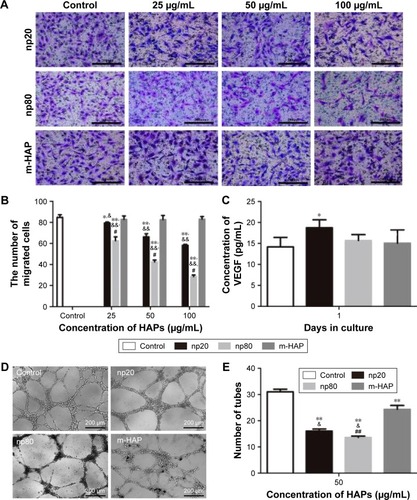
Figure 8 HAPs suppress angiogenesis through the inhibition of PI3K/Akt-dependent eNOS/NO pathway.
Notes: The expression profile of key proteins in the PI3K/Akt/eNOS pathway in HUVECs cultured with np20 (A1), np80 (A2) and m-HAP (A3) for 24 h. (B) NO levels of HUVECs incubated with HAPs for 24 h. *P<0.01 versus control, &P<0.01 versus m-HAP group, #P<0.05; ##P<0.01 versus np20 group. Cells without HAPs treatment were set as the control group. (C) NO levels and (D) cell viability of HUVECs exposed to HAPs in the presence or absence of IGF-1, respectively. *P<0.05; **P<0.01 versus vehicle control.
Abbreviations: HAP, hydroxyapatite; HUVECs, human umbilical vein endothelial cells; m-HAP, micro-sized HAP particles; NO, nitric oxide.
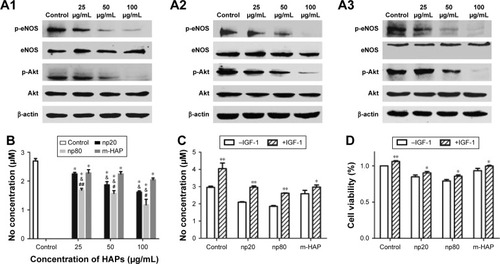
Figure 9 A schematic graph of the possible mechanisms.
Abbreviations: ECs, endothelial cells; HANPs, hydroxyapatite nanoparticles; NO, nitric oxide.
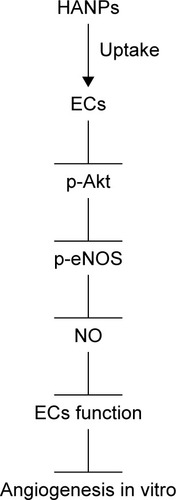
Figure S1 Effects of HAPs on the cell cycle of HUVECs.
Notes: Cell cycle of HUVECs after treatment with np20 (A), np80 (B) and m-HAP (C) for 24 h. P<0.05 versus control. Cells without HAP treatment were set as the control group.
Abbreviations: HAP, hydroxyapatite; HUVECs, human umbilical vein endothelial cells; m-HAP, micro-sized HAP particles.
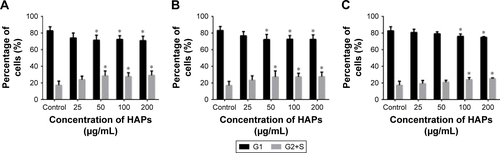
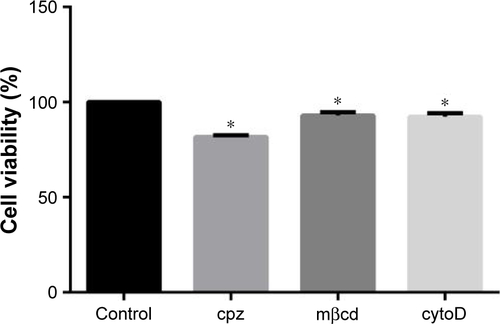
Figure S2 Effects of endocytosis inhibitors on cell viability.
Notes: The viability of HUVECs cultured with cpz, mβcd and cytoD for 30 min. P<0.01 versus control. Cells without endocytosis inhibitors treatment were set as control group.
Abbreviations: cpz, chlorpromazine; cytoD, cytochalasin D; HUVECs, human umbilical vein endothelial cells; mβcd, methyl-β-cyclodextrin.