Figures & data
Figure 1 The antibacterial activity of laser-generated Ag-TiO2 NPs against Gram-positive and Gram-negative bacteria.
Notes: TEM image of laser Ag-TiO2 NPs (A). Size distribution of laser Ag-TiO2 NPs (B). UV-vis spectrum of Ag-TiO2 NPs (C) and TiO2 NPs (D). A lawn of Escherichia coli, Staphylococcus aureus and Pseudomonas aeruginosa were made on Muller–Hinton agar plates and then 6 mm wells were created through the agar. Ag-TiO2 NPs 50 µL at different concentrations (0, 10, 20, 30, 40, 50 and 60 µg/mL) were added into each well in triplicate for each concentration, and the plates were incubated at 37°C for 24 hours. ZOI (E) was measured and the readings were corrected by the diameter of the well (F). Data are presented as mean ± SE. Compared to S. aureus at the same concentration of Ag NPs, *P≤0.05, **P≤0.01; n=3.
Abbreviations: NP, nanoparticle; TEM, transmission electron microscopy; ZOI, zone of inhibition.
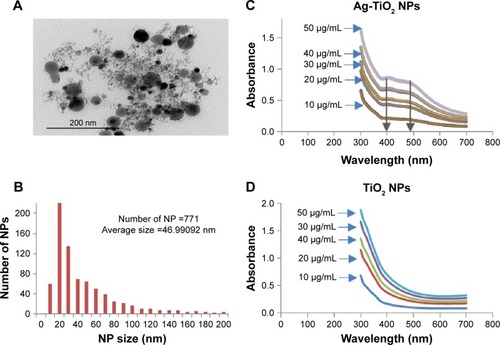
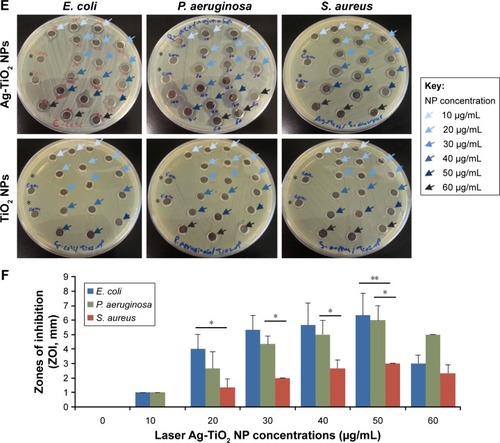
Figure 2 The effect of laser-generated Ag-TiO2 NPs on the production of ROS in Escherichia coli.
Notes: Different concentrations of laser Ag-TiO2 NPs (10, 30 and 50 µg/mL) were cultured with E. coli for 5 hours in triplicate. The ROS levels were measured using the DCFH-DA kit and presented as the fluorescence intensity. Data are mean ± SE. Compared to the NP-free control, ***P≤0.001, n=3.
Abbreviations: DCFH-DA, dichlorofluorescein diacetate; NP, nanoparticle; ROS, reactive oxygen species.
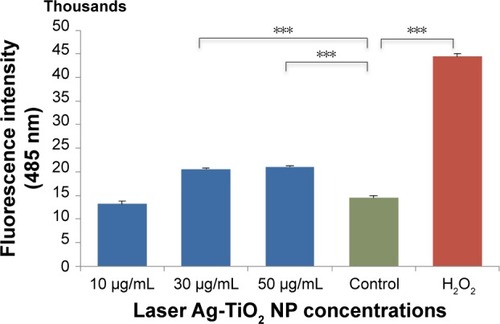
Figure 3 Changes of cellular glutathione reductase level in laser Ag-TiO2 NP-treated Escherichia coli.
Notes: E. coli were treated with laser Ag-TiO2 NPs (15 µg/mL) for 3 hours. The cellular glutathione reductase level was measured using the glutathione assay kit (Sigma). H2O2 (4 µg/mL) treatment was used as a positive control, and the NP-free dH2O as a negative control. Data are presented as mean ± SE. Compared to the NP-free control, ***P≤0.001, n=3.
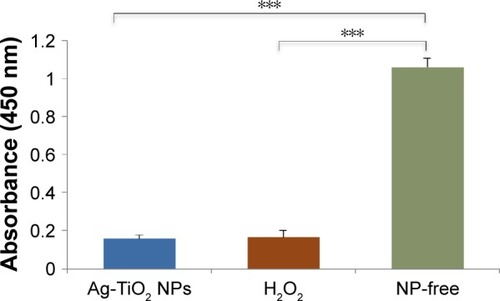
Figure 4 Lipid peroxidation in Escherichia coli by laser-generated Ag-TiO2 NPs.
Notes: Bacterial cells were treated with different concentrations of laser Ag-TiO2 NPs for 3 hours. Cellular level of malondialdehyde was then measured using the MDA assay Kit (Sigma-Aldrich). Data are presented as mean ± SE. Compared to the NP-free control, **P≤0.01, n=3.
Abbreviations: MDA, malondialdehyde; NP, nanoparticle.
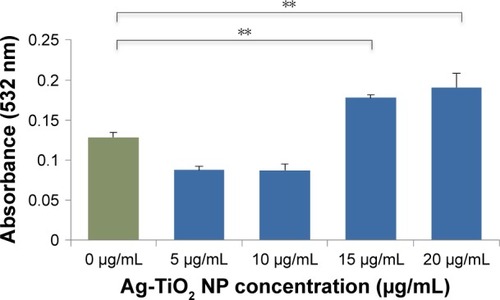
Figure 5 Effect of laser-generated Ag-TiO2 NPs on Escherichia coli membrane integrity.
Notes: E. coli were treated with different concentrations of laser Ag-TiO2 NPs for 24 hours. The culture media were subject for cell membrane integrity analysis using either the LDH assay kit (A) or the Coomassie reagent (B). A positive control was used for the LDH method by freezing and thawing the E. coli culture to physically break up the cell membrane integrity, named as maximum LDH release (A). Data are mean ± SE. Compared to the NP-free control, *P≤0.05, **P≤0.01 and ***P≤0.001; n=3.
Abbreviations: LDH, lactate dehydrogenase; NP, nanoparticle.
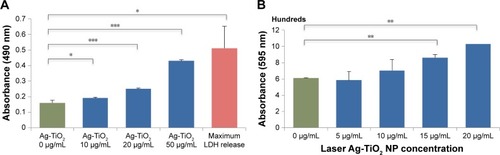
Figure 6 DNA degradation by laser Ag-TiO2 NPs in Escherichia coli.
Notes: E. coli were treated by laser-generated Ag-TiO2 NPs (10 µg/mL) or laser Ag NPs (10 µg/mL) overnight. Genomic DNA were extracted and 200 ng DNA were subjected to agarose gel electrophoresis (A). The intensity of the major DNA bands were quantified and shown in (B). Lane 1, Hyperladder I (BioLine); Lane 5–7, laser Ag-TiO2 NPs; Lane 2–4, laser Ag NPs; Lane 8–10, NP-free Control. Data were presented as mean ± SE. Compared to the NP-free control, *P≤0.05, n=3.
Abbreviation: NP, nanoparticle.
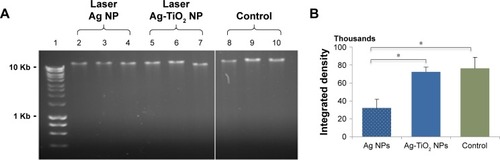
Figure 7 Cytotoxicity of laser-generated Ag-TiO2 NPs to human cells.
Notes: (A) The laser-generated Ag-TiO2 NPs at two concentrations (2.5 and 20 µg/mL) were incubated with 5 types of human cells or cell lines: A549 (lung), hCAECs (blood vessel), HEK293 (kidney), HDFc (skin) and the HepG2 (liver), for 24, 48 and 72 hours. Cytotoxicity was determined using MTT assay. (B) H2O2 was used as a positive control. HDFc and hCAECs were treated with either 40 µg/mL H2O2 or with 20 µg/mL Ag-TiO2 NPs for 24 hours. Toxicity to the cells were measured using MTT assay. Data were presented as mean ± SE. Compared to the NP-free control, *P≤0.05, ***P≤0.001, n=3.
Abbreviations: hCAECs, human coronary artery endothelium cells; HDFc, human dermal fibroblast cells; NP, nanoparticle.
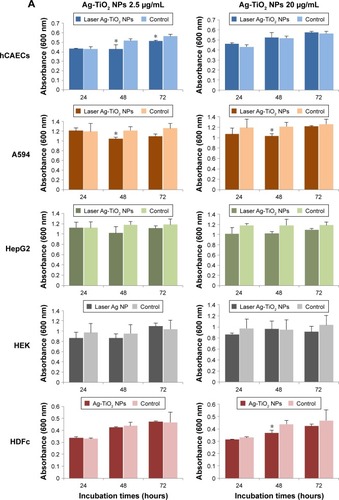
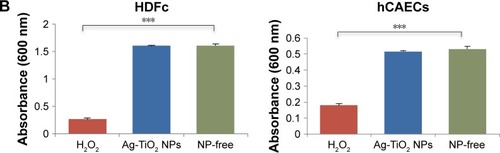
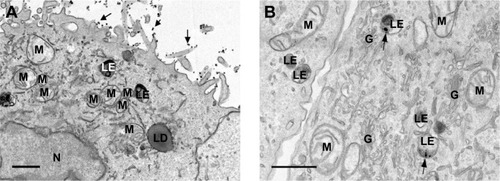
Figure 8 TEM images of human lung A549 cell line treated with laser-generated Ag-TiO2 NPs.
Notes: TEM imaging was conducted on A549 cells that were treated with laser-generated Ag-TiO2 NPs (20 µg/mL) for 24 hours. Arrows in (A) indicate extracellular Ag-TiO2 NPs. Arrows in (B) indicate intracellular Ag-TiO2 NPs within late endosomes. Scale bars indicate 1 µm.
Abbreviations: G, golgi; LD, lipid droplet; LE, late endosomes; M, mitochondria; N, nucleus; NP, nanoparticle; TEM, transmission electron microscopy.