Figures & data
Figure 1 Synthesis steps of different polymers.
Notes: (A) d,l-Lactide; (B) mPEG-PDLLA; (C) mPEG-PDLLA-Phe-NBOC; (D) mPEG-PDLLA-NH2; (E) mPEG-PDLLA-PBLG and mPEG-PDLLA-PBLL; (F) mPEG-PDLLA-PLG and mPEG-PDLLA-PLL.
Abbreviations: mPEG, methoxy PEG; PDLLA, poly(d,l-lactide); PEG, poly(ethylene glycol); Phe-NBOC, N-(tert-butoxycarbonyl)-l-phenylalanine; PLG, polyglutamate; PLL, poly(l-lysine); PBLG, poly(γ-benzyl-l-glutamate); PBLL, poly(γ-benzyl-l-lysine); TFA, trifluoroacetic acid.
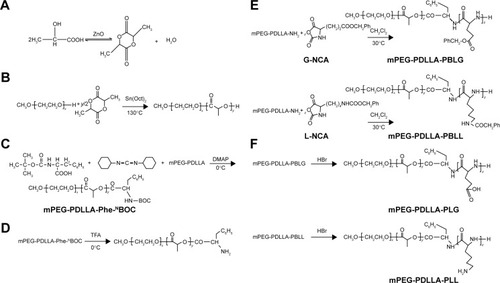
Figure 2 Structural representations of mPEG-PDLLA-PBLG and mPEG-PDLLA-PBLL.
Abbreviations: PEG, poly(ethylene glycol); PDLLA, poly(d,l-lactic acid); mPEG, methoxy PEG; PBLG, poly(γ-benzyl-l-glutamate); PBLL, poly(γ-benzyl-l-lysine).
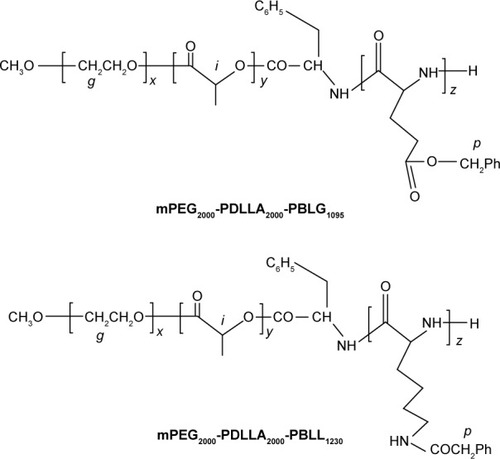
Table 1 Composition and molecular characteristics of polymers
Table 2 Molecular weight calculated from 1H-NMR and GPC
Table 3 Drug loading and entrapment efficiency of DPT micelle solutions
Table 4 Particle size distribution of DPT micelles after reconstitution
Figure 3 TEM images and DSC thermograms of DPT formulations.
Notes: (A) TEM images of (a) DPT-PM and (b) DPT-PCM. (B) DSC thermograms of (a) DPT; (b) PICs; (c) physical mixture composed of DPT and PICs (weight ratio of DPT/PICs =1/5); and (d) DPT-PCM (weight ratio of DPT/PICs =1/5).
Abbreviations: DPT, deoxypodophyllotoxin; DSC, differential scanning calorimetry; PCM, polyion complex micelle; PEG, poly(ethylene glycol); PDLLA, poly(d,l-lactide); PIC, polyion complex; mPEG, methoxy PEG; PLG, polyglutamate; PLL, poly(l-lysine); PM, polymeric micelle; TEM, transmission electron microscopy.
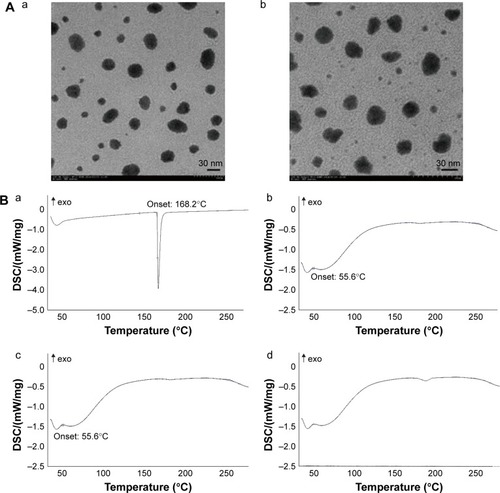
Figure 4 Stability tests of DPT-PCM and DPT-PM.
Notes: DPT-loaded PMs and size changes over time at (A) 4°C, (B) 25°C, and (C) 37°C. The effect of temperature on the physical stabilities of drug-loaded micelles at (D) 4°C, (E) 25°C, and (F) 37°C. Data are shown as mean ± SD (n=3). ***P<0.001 as compared to DPT-PM, respectively.
Abbreviations: DPT, deoxypodophyllotoxin; PCM, polyion complex micelle; PM, polymeric micelle.
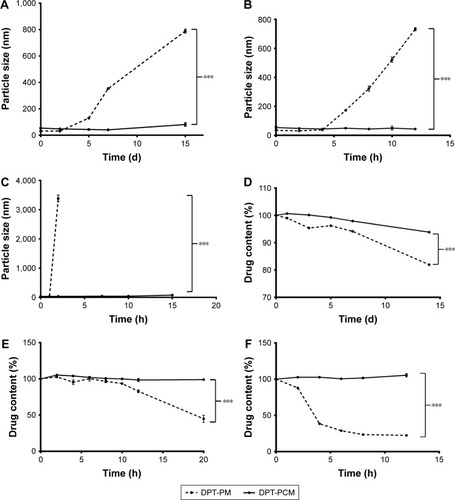
Figure 5 The in vitro cytotoxicity of blank PM, blank PCM, DPT, DPT-PM, and DPT-PCM against A549 cells after (A) 24 h and (B) 48 h of incubation.
Notes: Data are shown as mean ± SD (n=6). ***P<0.001 as compared to DPT, blank-PM, and blank-PCM at 24 h and 48 h. **P<0.01 as compared to DPT-PM at 48 h.
Abbreviations: DPT, deoxypodophyllotoxin; PCM, polyion complex micelle; PM, polymeric micelle.
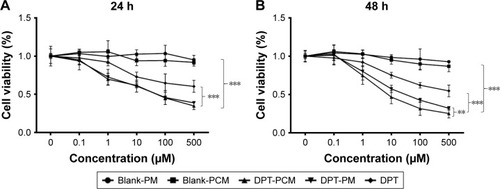
Figure 6 Investigation on drug release, pharmacokinetics, and histopathological changes.
Notes: (A) (a) Cumulative release profiles of DPT from DPT-PCM at pH 7.4, pH 6.8, and pH 5.0 (mean ± SD, n=3). *P<0.05 and **P<0.01 as compared to DPT-PM at the same pH. ***P<0.001 as compared to pH 7.4. (b) The profile of the plasma DPT concentration vs time after intravenous administration of 15 mg/kg dose of DPT-PCM and 15 mg/kg dose of DPT-PM (mean ± SD, n=6). (B) Histopathological photograph of an ear vein (scale bar =100 µm).
Abbreviations: DPT, deoxypodophyllotoxin; PCM, polyion complex micelle; PM, polymeric micelle.
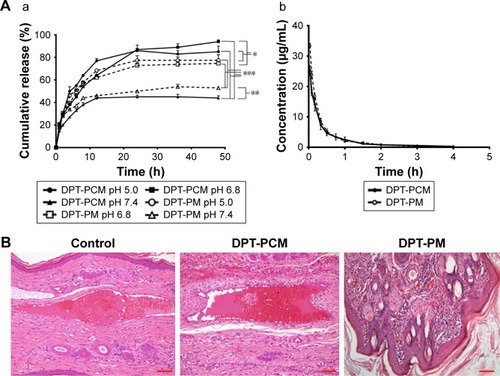
Table 5 Pharmacokinetic parameters of DPT-PCM and DPT-PM
Figure S1 1H-NMR spectra at 300 M of (A) mPEG-PDLLA; (B) mPEG-PDLLA-Phe-NBOC; (C) mPEG-PDLLA–NH2; (D) mPEG-PDLLA-PBLG; (E) mPEG-PDLLA-PBLL; (F) mPEG-PDLLA-PLG; and (G) mPEG-PDLLA-PLL.
Abbreviations: DPT, deoxypodophyllotoxin; mPEG, methoxy polyethylene glycol; NMR, nuclear magnetic resonance; PDLLA, poly(d,l-lactide); PLG, polyglutamate; PLL, poly(l-lysine); Phe-NBOC, N-(tert-butoxycarbonyl)-l-phenylalanine; PBLG, poly(γ-benzyl-l-glutamate); PBLL, poly(γ-benzyl-l-lysine).
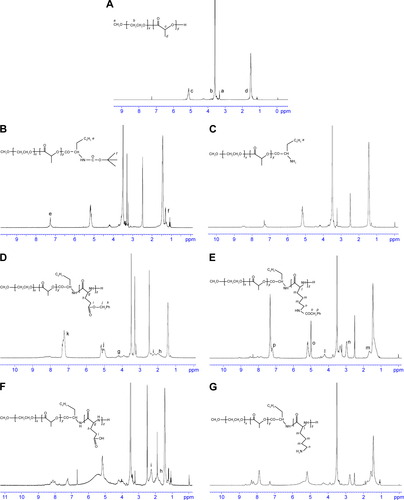
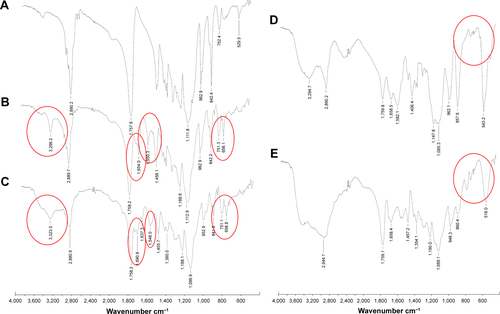
Figure S2 FT-NIR spectra of block copolymer (A) mPEG-PDLLA; (B) mPEG-PDLLA-PBLG; (C) mPEG-PDLLA-PBLL; (D) mPEG-PDLLA-PLG; and (E) mPEG-PDLLA-PLL.
Note: Characteristic peaks are circled in red.
Abbreviations: FT-NIR, Fourier transform near-infrared; mPEG, methoxy polyethylene glycol; PDLLA, poly(d,l-lactide); PLG, polyglutamate; PLL, poly(l-lysine); PBLG, poly(γ-benzyl-l-glutamate); PBLL, poly(γ-benzyl-l-lysine).