Figures & data
Table 1 Primers used for quantitative real-time PCR for the analysis of apoptotic, and anti-apoptotic, gene expression
Figure 1 Characterization of GO and GO-AgNP nanocomposite using UV-visible spectroscopy.
Notes: (A) GO spectra exhibited a maximum absorption peak at ~230 nm corresponding to the π–π transitions of aromatic C–C bonds. A new peak at 420 nm was observed after deposition of AgNPs on the GO surface; the band at 420 nm in the absorption spectrum of the GO-AgNPs is attributed to the surface plasmons and presence of AgNPs. (B) XRD patterns of GO and GO-AgNPs. In the XRD pattern of GO, a strong, sharp peak at 2θ=11.7° corresponds to an interlayer distance of 7.6 Å. The GO-AgNPs showed distinct reflections in the XRD pattern at 31.8 corresponding to the (111) plane of face-centered cubic Ag. (C) FTIR spectra of GO and GO-AgNPs. Dried powders of GO and GO-AgNPs were diluted with KBr to perform FTIR spectroscopy and spectrum GX spectrometry within the range of 500–4,000 cm−1. (D) SEM images of GO and GO-AgNP dispersions at 500 μg/mL. (E) TEM images of GO and GO-AgNPs. (F) Raman spectroscopy analyses of GO and GO-AgNP nanocomposite. Raman spectra of GO and GO-AgNPs were obtained using a laser excitation wavelength of 532 nm at a power of 1 mW after the removal of background fluorescence. At least three independent experiments were performed for each sample, and reproducible results were obtained.
Abbreviations: AgNP, silver nanoparticle; FTIR, Fourier transform infrared; GO, graphene oxide; SEM, scanning electron microscopy; TEM, transmission electron microscopy; XRD, X-ray diffraction.
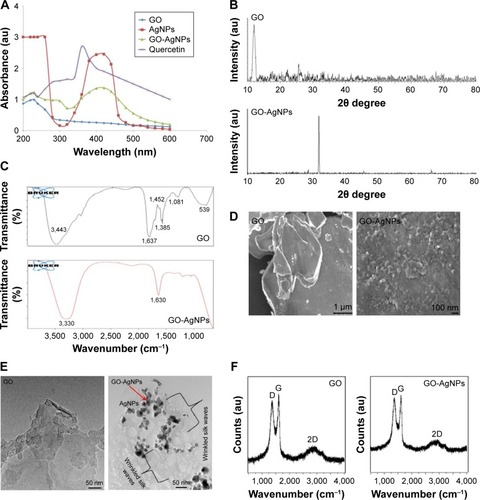
Figure 2 Effects of GO and GO-AgNPs on cell viability of human ovarian cancer cells.
Notes: (A) The viability of human neuroblastoma cancer cells was determined after 24 h exposure to different concentrations of GO (0–50 μg/mL). (B) The viability of human neuroblastoma cancer cells was determined after 24 h exposure to different concentrations of GO-AgNPs (0–10 μg/mL) using the CCK-8 assay. The results are expressed as the mean ± standard deviation of three independent experiments. The treated groups showed statistically significant differences from the control group by the Student’s t-test. *P<0.05.
Abbreviations: AgNP, silver nanoparticle; CCK, cell counting kit; GO, graphene oxide.
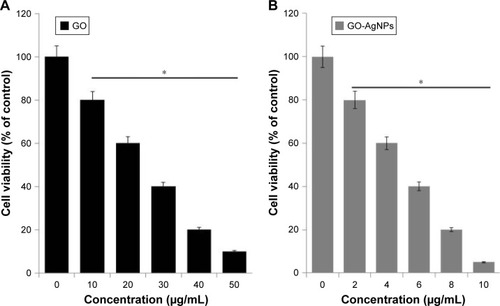
Figure 3 Effect of GO-AgNPs on proliferation of human neuroblastoma cancer cells.
Notes: (A) Cell proliferation was observed in the cells treated with GO (25 μg/mL) for 24 h by a trypan blue exclusion assay. (B) Cell proliferation was observed in the cells treated with GO-AgNPs (5 μg/mL) for 24 h by a trypan blue exclusion assay. The results are expressed as the mean ± standard deviation of three independent experiments. The treated groups showed statistically significant differences from the control group by the Student’s t-test. *P<0.05.
Abbreviations: AgNP, silver nanoparticle; GO, graphene oxide.
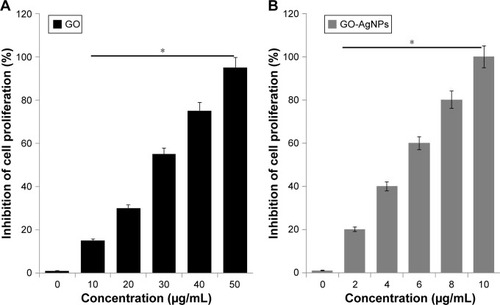
Figure 4 Effect of GO and GO-AgNPs on cytotoxicity in human neuroblastoma cancer cells.
Notes: (A) The cells were treated with GO (25 μg/mL), GO-AgNPs (5 μg/mL), and DOX (1 μg/mL) for 24 h, and LDH activity was measured at 490 nm using the LDH cytotoxicity kit (B) The cells were treated with GO (25 μg/mL), GO-AgNPs (5 μg/mL), and DOX (1 μg/mL) for 24 h, and the dead-cell protease levels were determined by a CytoTox-Glo™ cytotoxicity assay. The results are expressed as the mean ± standard deviation of three independent experiments. The treated groups showed statistically significant differences from the control group by the Student’s t-test. *P<0.05.
Abbreviations: AgNP, silver nanoparticle; Con, control; DOX, doxorubicin; GO, graphene oxide; LDH, lactate dehydrogenase.
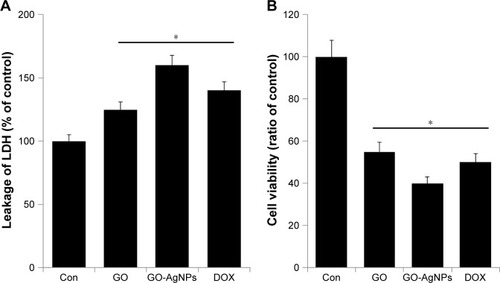
Figure 5 Effect of GO and GO-AgNPs on mitochondrial dysfunction in human neuroblastoma cancer cells.
Notes: (A) The cells were treated with GO (25 μg/mL), GO-AgNPs (5 μg/mL), and DOX (1 μg/mL) for 24 h, and the mitochondrial membrane potential was determined using the cationic fluorescent indicator JC-1. (B) The cells were treated with GO (25 μg/mL), GO-AgNPs (5 μg/mL), and DOX (1 μg/mL) for 24 h, and the mitochondria copy number was determined by real-time PCR. *P<0.05.
Abbreviations: AgNP, silver nanoparticle; Con, control; DOX, doxorubicin; GO, graphene oxide; PCR, polymerase chain reaction.
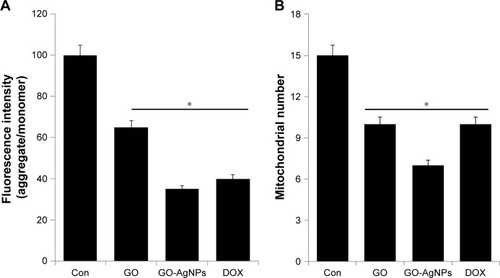
Figure 6 Effect of GO and GO-AgNPs on ROS generation and MDA levels in human neuroblastoma cancer cells.
Notes: (A) The cells were treated with GO (25 μg/mL), GO-AgNPs (5 μg/mL), and DOX (1 μg/mL) for 24 h. Relative fluorescence of DCF was measured at the excitation wavelength of 485 nm and emission wavelength of 530 nm using a spectrofluorometer. (B) The cells were treated with GO (25 μg/mL), GO-AgNPs (5 μg/mL), and DOX (1 μg/mL) for 24 h. After incubation, the cells were harvested and washed twice with an ice-cold PBS solution. The cells were collected and disrupted by ultrasonication for 5 min on ice. The concentration of MDA was measured on a microplate reader at a wavelength of 530 nm. The results are expressed as the mean ± standard deviation of three independent experiments. The treated groups showed statistically significant differences from the control group by the Student’s t-test. *P<0.05.
Abbreviations: AgNP, silver nanoparticle; Con, control; DCF, 2′,7′-dichlorofluorescein; DOX, doxorubicin; GO, graphene oxide; MDA, malondialdehyde; PBS, phosphate-buffered saline; ROS, reactive oxygen species.
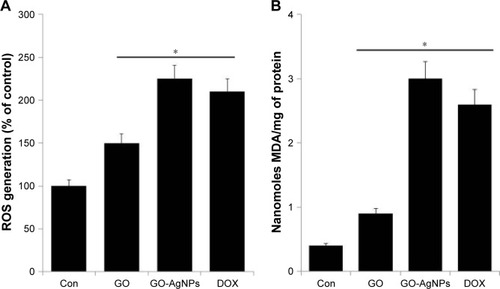
Figure 7 Effect of GO and GO-AgNPs on expression of apoptotic and anti-apoptotic genes in human neuroblastoma cancer cells.
Notes: The cells were treated with GO (25 μg/mL), GO-AgNPs (5 μg/mL), and DOX (1 μg/mL) for 24 h. Relative mRNA expression was analyzed by qRT-PCR in human neuroblastoma cancer cells after the treatments. The results are expressed as the mean ± standard deviation of three independent experiments. The treated groups showed statistically significant differences from the control group by the Student’s t-test. *P<0.05.
Abbreviations: AgNP, silver nanoparticle; Con, control; DOX, doxorubicin; GO, graphene oxide; mRNA, messenger RNA; qRT-PCR, quantitative reverse transcription polymerase chain reaction.
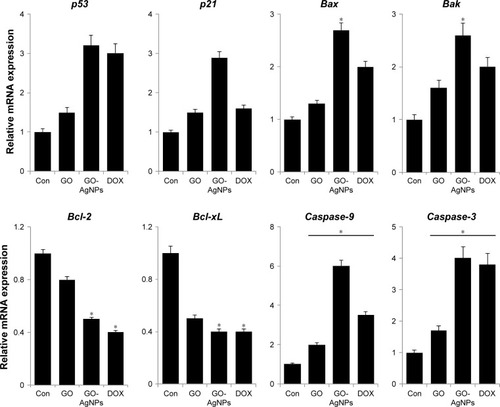
Figure 8 Effect of GO and GO-AgNPs on caspase-9/3 activity in human neuroblastoma cancer cells.
Notes: (A) The cells were treated with GO (25 μg/mL), GO-AgNPs (5 μg/mL), and DOX (1 μg/mL) for 24 h with and without caspase-9 inhibitor. The concentration of p-nitroanilide released from the substrate was calculated from the absorbance at 405 nm. (B) The cells were treated with GO (25 μg/mL), GO-AgNPs (5 μg/mL), and DOX (1 μg/mL) for 24 h with and without caspase-3 inhibitor. The concentration of p-nitroanilide released from the substrate was calculated from the absorbance at 405 nm. The results are expressed as the mean ± standard deviation of three independent experiments. The treated groups showed statistically significant differences from the control group by the Student’s t-test. *P<0.05.
Abbreviations: AgNP, silver nanoparticle; Con, control; DOX, doxorubicin; GO, graphene oxide.
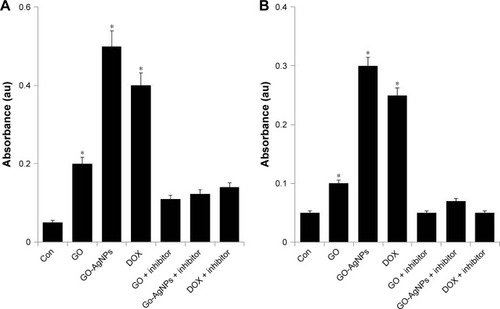
Figure 9 Effect of GO and GO-AgNPs on apoptosis in human neuroblastoma cancer cells.
Notes: The cells were treated with GO (25 μg/mL) (A), GO-AgNPs (5 μg/mL), and DOX (1 μg/mL) (B) for 24 h. Apoptosis of human neuroblastoma cancer cells after a 24-h treatment was assessed by the TUNEL assay; the nuclei were counterstained with DAPI. Representative images show apoptotic (fragmented) DNA (red staining) and the corresponding cell nuclei (blue staining). The images are ×100 magnification.
Abbreviations: AgNP, silver nanoparticle; Con, control; DAPI, 4′,6-diamidino-2-phenylindole; DOX, doxorubicin; GO, graphene oxide; TUNEL, terminal deoxynucleotidyl transferase dUTP nick end labeling.
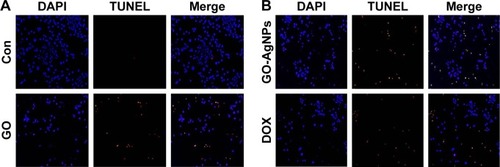
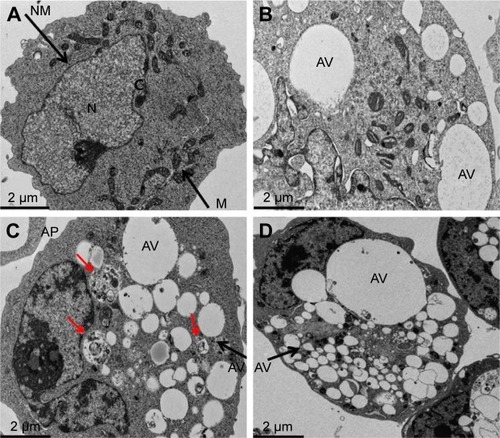
Figure 10 GO- and GO-AgNP-induced accumulation of APs and autophagic vacuoles.
Notes: The cells were treated with (A) control, (B) GO (25 μg/mL), (C) GO-AgNPs (5 μg/mL), and (D) DOX (1 μg/mL) for 24 hours and processed for TEM. GO-AgNPs-treated cells in C showed many multi-vesicular and membrane-rich APs and significant accumulation of autophagic vacuoles compared with that of GO and Con (red arrows).
Abbreviations: AgNP, silver nanoparticle; AP, autophagosome; AV, autophagic vacuoles; C, cytoplasm; Con, control; DOX, doxorubicin; GO, graphene oxide; M, mitochondria; N, nucleus; TEM, transmission electron microscopy.