Figures & data
Figure 1 Illustrative diagrams of the procedure for PCL/NS preparation and the biological effect of PCL/NS in vitro and in vivo.
Abbreviations: AgNO3, silver nitrate; DA, dopamine; NS, nanosilver; PCL, polycaprolactone.
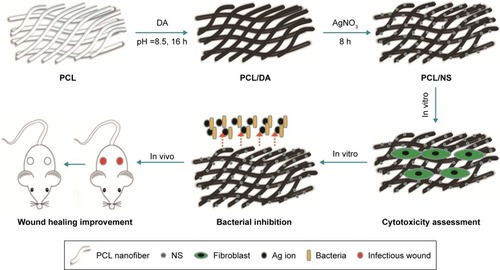
Figure 2 Morphology of (A) PCL, (B) PCL/DA, (C) PCL/NS0.5, (D) PCL/NS1.0 and (E) PCL/NS2.0; (F) the diameter of NS (n=5).
Notes: Magnification of images ×3,000; magnification of insets ×15,000.
Abbreviations: DA, dopamine; NS, nanosilver; PCL, polycaprolactone.
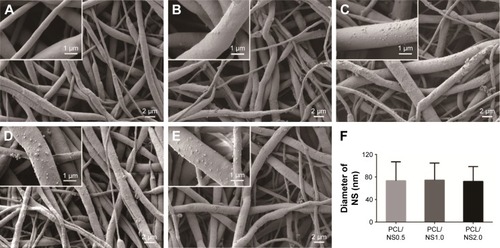
Figure 3 FTIR spectra of the following: A, PCL; B, PCL/DA; C, PCL/NS0.5; D, PCL/NS1.0; E, PCL/NS2.0 (n=3).
Abbreviations: DA, dopamine; FTIR, Fourier transform infrared; NS, nanosilver; PCL, polycaprolactone.
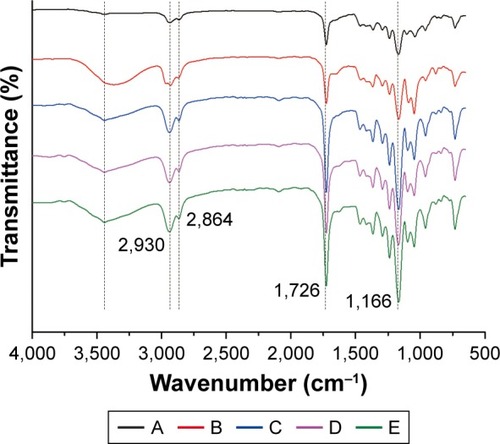
Figure 4 Water contact angle of (A) PCL, (B) PCL/DA, (C) PCL/NS0.5, (D) PCL/NS1.0 and (E) PCL/NS2.0 (n=3).
Abbreviations: DA, dopamine; NS, nanosilver; PCL, polycaprolactone.
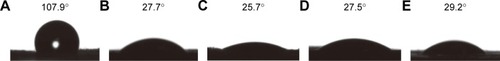
Figure 5 OD600 values of (A) S. aureus, (B) E. coli and (C) A. baumannii bacterial suspensions after 24 h of co-incubation with samples. Data are presented as mean ± SD (n=3). The detection of survival bacteria in the bacterial suspensions from the (D) control, (E) PCL, (F) PCL/DA, (G) PCL/NS0.5, (H) PCL/NS1.0 and (I) PCL/NS2.0 groups.
Notes: *p<0.05 and **p<0.01.
Abbreviations: A. baumannii, Acinetobacter baumannii; DA, dopamine; E. coli, Escherichia coli; NS, nanosilver; OD, optical density; PCL, polycaprolactone; S. aureus, Staphylococcus aureus.
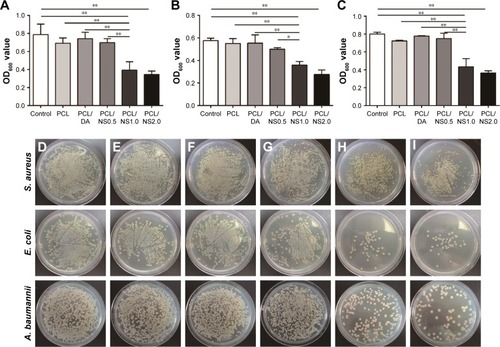
Figure 6 The effect of PCL/NS on the formation of biofilms.
Notes: (A) SEM morphology of biofilms on the surfaces of PCL, PCL/DA, PCL/NS0.5, PCL/NS1.0 and PCL/NS2.0; the red arrows indicate the adherent bacteria. The quantitative area covered by the biofilms of (B) S. aureus, (C) E. coli and (D) A. baumannii. Scale bars: 1 µm. Magnification of images in PCL, PCL/DA and PCL/NS0.5 groups are ×3,000, and the magnification of images in PCL/NS1.0 and PCL/NS2.0 groups are ×5,000. **p<0.01.
Abbreviations: A. baumannii, Acinetobacter baumannii; DA, dopamine; E. coli, Escherichia coli; NS, nanosilver; PCL, polycaprolactone; S. aureus, Staphylococcus aureus; SEM, scanning electron microscopy.
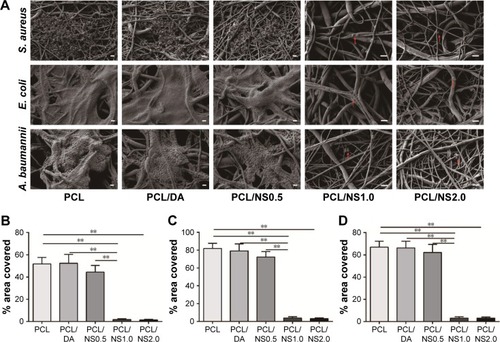
Figure 7 Fluorescence microscopy images of GFP transgenic fibroblasts on the (A) PCL/DA, (B) PCL/NS0.5, (C) PCL/NS1.0 and (D) PCL/NS2.0 films; (E) the cell viability measured using CCK8 assay at days 1, 3 and 5 post seeding.
Note: Magnification ×200. *p<0.05.
Abbreviations: CCK8, Cell Counting Kit-8; DA, dopamine; GFP, green fluorescent protein; NS, nanosilver; PCL, polycaprolactone.
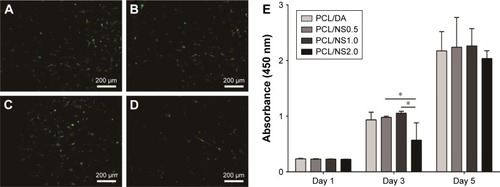
Figure 8 Silver ion release profile of PCL/NS at days 1, 3, 5 and 7.
Note: Data are presented as mean ± SD (n=3).
Abbreviations: NS, nanosilver; PCL, polycaprolactone.
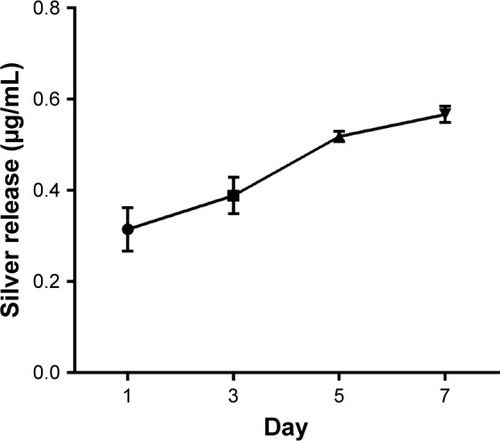
Figure 9 The effect of PCL/NS1.0 on the healing of infectious wounds.
Notes: (A) The representative macroscopic appearance of wounds from the blank, control, PCL, PCL/DA and PCL/NS1.0 groups. (B) The closed wound area at predetermined time points. Data are presented as mean ± SD (n=5). The significant difference between PCL/NS1.0 and the control, PCL and PCL/DA groups, *p<0.05, **p<0.01.
Abbreviations: DA, dopamine; NS, nanosilver; PCL, polycaprolactone.
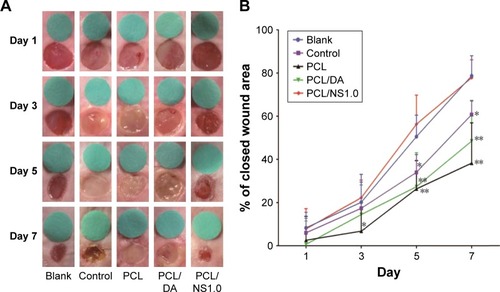
Figure 10 The effect of PCL/NS1.0 on re-epithelialization.
Notes: Representative histological images of the length of the newly generated epidermis taken at day 7 post surgery in the (A) blank, (B) control, (C) PCL, (D) PCL/DA and (E) PCL/NS1.0 groups. The yellow double-headed arrows refer to the length of the newly generated epidermis. (F) Calculation of the length of the newly generated epidermis at day 7 post surgery. Data are presented as mean ± SD (n=4), and the significant difference between the PCL/NS1.0 group and the control, PCL or PCL/DA group, **p<0.01. Scale bars: 200 µm. Magnification ×100.
Abbreviations: DA, dopamine; NS, nanosilver; PCL, polycaprolactone.
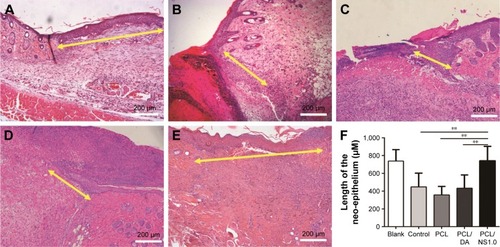
Figure 11 The expression of PCNA in keratinocytes on the edge of wound at day 7 post surgery.
Notes: Representative images of immunohistochemical staining of PCNA taken from the (A) blank, (B) control, (C) PCL, (D) PCL/DA and (E) PCL/NS1.0 groups. The rectangular insets represent the magnified areas, while the black arrows indicate PCNA-positive keratinocytes. (F) Counting of PCNA-positive keratinocytes per field in newly generated epidermis. Data are presented as mean ± SD (n=4). Scale bars: 200 µm (low magnification ×100) and 50 µm (high magnification ×400). **p<0.01.
Abbreviations: DA, dopamine; NS, nanosilver; PCL, polycaprolactone; PCNA, proliferating cell nuclear antigen.
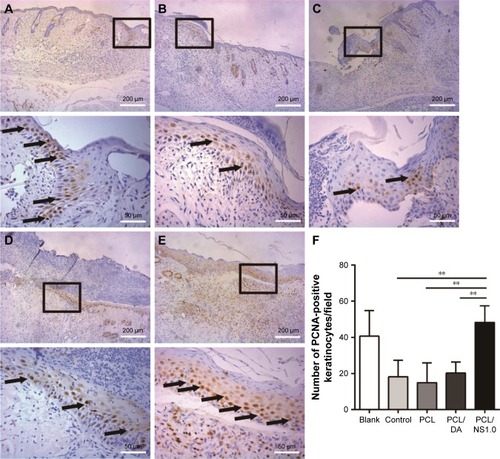
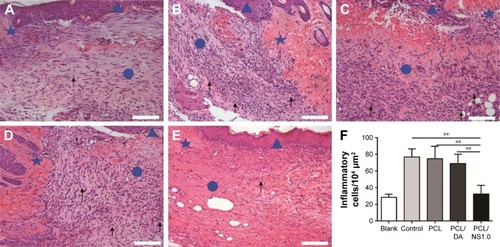
Figure 12 The inflammatory cells infiltrated in the subcutaneous areas of wound edge at day 7 post surgery.
Notes: Representative H&E staining images of the (A) blank, (B) control, (C) PCL, (D) PCL/DA and (E) PCL/NS1.0 groups. The triangle represents the newly formed epidermis, the circle represents the wound area, and the pentagram represents unwounded skin tissue. The black arrows indicate the inflammatory cells. (F) Counting of inflammatory cells infiltrated in the subcutaneous areas of wound edge. Data are presented as mean ± SD (n=4). Scale bars: 100 µm. Magnification ×200. **p<0.01.
Abbreviations: DA, dopamine; H&E, hematoxylin–eosin; NS, nanosilver; PCL, polycaprolactone.