Figures & data
Figure 1 Synthesis of PEI derivatives.
Notes: LMW branched PEI (1,800 Da) was initially modified by the conjugation of predominantly primary amines with succinic anhydride. This modification also provided the terminal carboxylate groups to which other LMW PEIs could be grafted in the next step.
Abbreviations: LMW, low molecular weight; PEI, polyethylenimine.
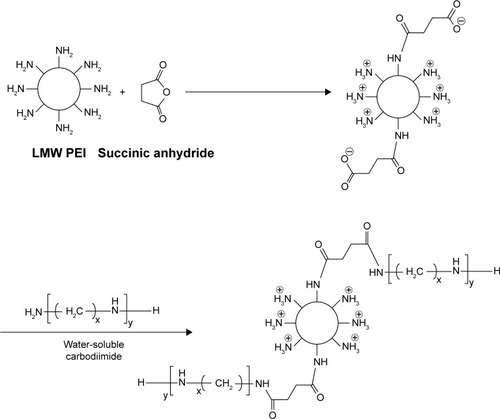
Figure 2 Measurement of the buffering capacity.
Notes: Titration curves for aqueous solutions (0.4 mg/mL) of unmodified PEI and its derivatives, PEI-SUC and PEI-SUC-PEI, with 1 M HCl from pH 12 to 2. Solutions were adjusted to pH 12 with 1 M NaOH, then a series of 5 mL aliquots of 1 M HCl were added with stirring and the pH measured after each addition. Water has been included as a control.
Abbreviations: PEI, polyethylenimine; PEI-SUC, PEI-succinate conjugate; PEI-SUC-PEI, PEI-succinate-PEI conjugate.
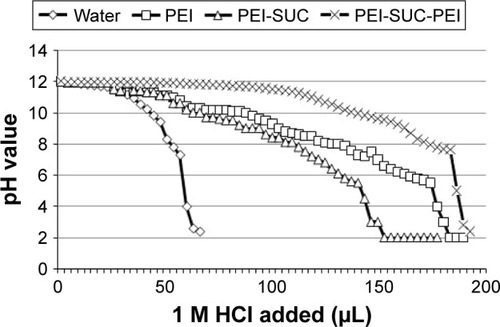
Figure 3 Binding affinity of pDNA with PEI conjugates.
Notes: (A) Ethidium bromide exclusion assay was performed by fluorescence quenching when ethidium bromide is prevented from intercalation in pDNA by polycation binding in HBG buffer. (B) Gel retardation assay at various C/P ratios.
Abbreviations: pDNA, plasmid DNA; PEI, polyethylenimine; PEI-SUC, PEI-succinate conjugate; PEI-SUC-PEI, PEI-succinate-PEI conjugate; HBG, HEPES buffered glucose solution; C/P, carrier to plasmid ratio.
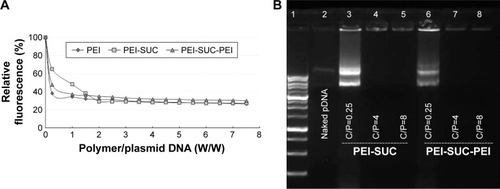
Figure 4 Particle size and zeta potential of the polyplexes.
Note: The nanoparticles were formed with PEI and its conjugates in HBG buffer at C/P=8.
Abbreviations: C/P, carrier to plasmid ratio; LMW, low molecular weight; PEI, polyethylenimine; PEI-SUC, PEI-succinate conjugate; PEI-SUC-PEI, PEI-succinate-PEI conjugate; HBG, HEPES buffered glucose solution.
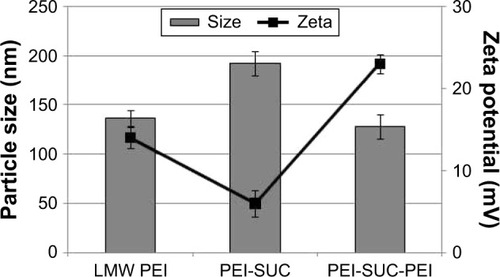
Figure 5 DNase I protection assay.
Notes: The polyplexes were prepared at C/P ratios of 0.25, 4, and 8 and mixed with 1 mL of DNase I enzyme or PBS followed by the addition of EDTA and mixing with SDS. Finally, agarose gel electrophoresis was performed to visualize the location of the plasmid bands.
Abbreviations: C/P, carrier to plasmid ratio; PEI, polyethylenimine; PEI-SUC, PEI-succinate conjugate; PEI-SUC-PEI, PEI-succinate-PEI conjugate.
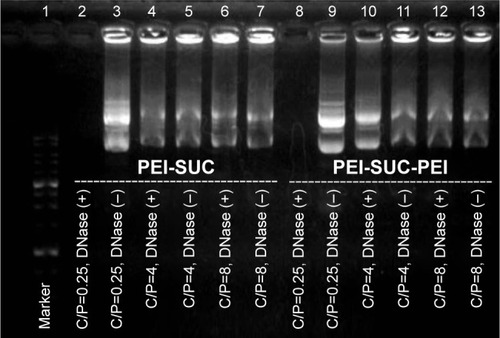
Figure 6 Cellular toxicity and transfection efficiency.
Notes: Viability and gene transfer ability of unmodified and modified PEI derivatives complexed with pDNA encoding CD200 gene at polymer:plasmid (weight:weight) ratios of 0.25, 4, and 8 determined in triplicate in SH-SY5Y cell cultures in 96-well plates. (A) Cell survival was assayed by the MTT method, and expressed as the percentages of cell viability. (B) CD200 expression level measured by flow cytometry. *P<0.05, PEI derivative compared to unmodified parent polymer at the same C/P ratio. (n=3; error bars represent mean ± standard deviation).
Abbreviations: C/P, carrier to plasmid ratio; pDNA, plasmid DNA; PEI, polyethylenimine; PEI-SUC, PEI-succinate conjugate; PEI-SUC-PEI, PEI-succinate-PEI conjugate.

Figure 7 In vivo imaging of MS induced mice using fluorescently labeled plasmid encoding CD200 at C/P ratio 8.
Notes: Mice were injected with the final volume of 100 μL of the polyplex formulation. (A) The control mice received 100 μL of HBG buffer. (B–I) Mice were injected with the polyplexes and imaging was performed at the time points of 0, 15, 30, 60, 120, 180 min and 24 h post injection. Magnification ×10.
Abbreviations: C/P, carrier to plasmid ratio; MS, multiple sclerosis; HBG, HEPES buffered glucose.
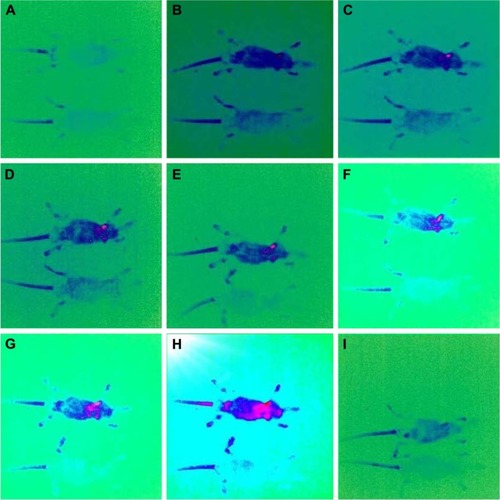
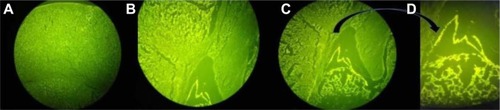
Figure 8 Fluorescent microscopy of the brain tissue.
Notes: (A) Normal brain tissue in control group. (B–D) Fluorescent polyplexes in periventricular area. (A–C) Magnification ×100. (D) Magnification ×400.