
Figures & data
Figure 1 The overview of proposed SuccinSite2.0 predictor.
Abbreviations: Ac, including accuracy; AUC, area under the receiver operating characteristics curve; IG, information gain; MCC, Matthews correlation coefficient; Sn, sensitivity; Sp, specificity.
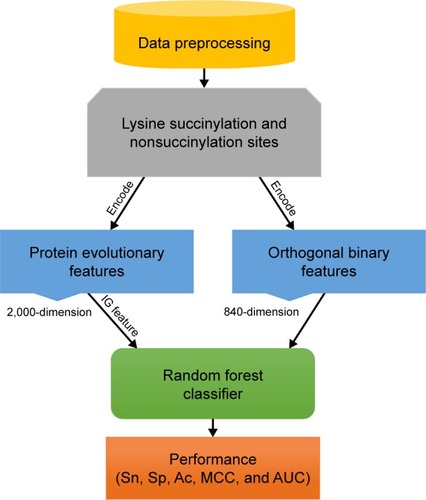
Table 1 The statistics of generic and species-specific lysine succinylated proteins and their succinylation sites used in this study
Figure 2 Sequence logo showing the occurrences of amino acid propensities of surrounding succinylation and candidate nonsuccinylation sites for seven different organisms, including Homo sapiens, Mus musculus, Escherichia coli, Mycobacterium tuberculosis, Saccharomyces cerevisiae, Toxoplasma gondii, and Solanum lycopersicum.
Notes: The sequence logo is generated by two sample logos software (http://www.twosamplelogo.org/). Copyright (c) 2005 Vladimir Vacic, Lilia M. Iakoucheva, and Predrag Radivojac.Citation34
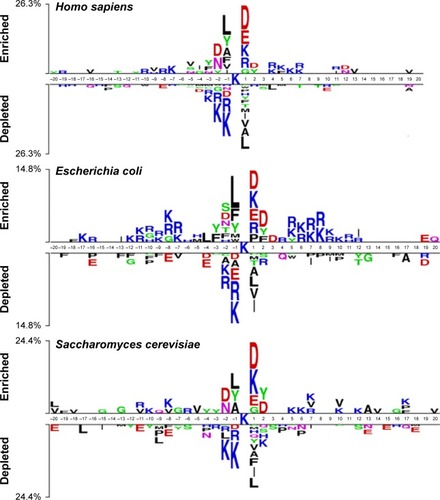
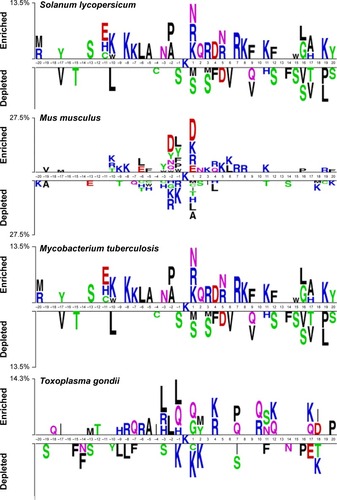
Figure 3 Average PSSM score (APS) for each position of surrounding succinylation (green color) and nonsuccinylation (gray color) fragments for seven species, especially those fragments located in the positions of approximately −20 to −1 and +1 to +20 window position.
Note: P-values were calculated using Kruskal–Wallis test (Table S1).
Abbreviation: APS, average PSSM score.
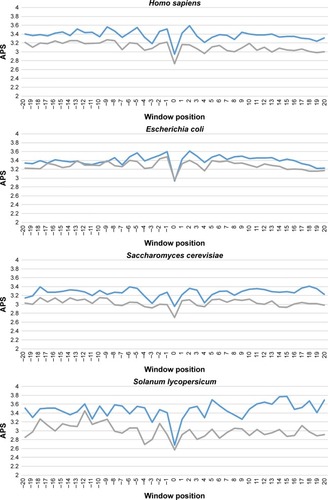
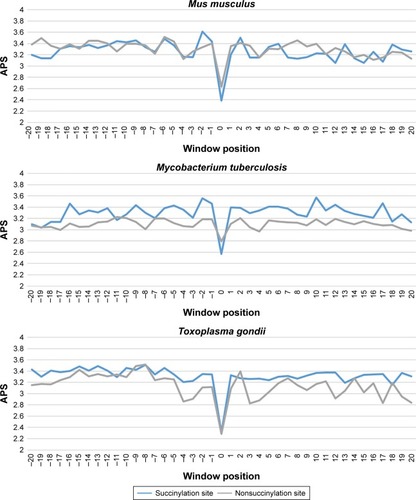
Table 2 Performance comparison of SuccinSite2.0 with existing predictors using independent testing dataset
Table 3 Performance comparison of SuccinSite2.0 with existing predictors using the new dataset
Figure 4 The performance of species-specific classifiers of SuccinSite2.0.
Notes: (A) Training set performances over fivefold cross-validation test. (B) Inde pendent test performances.
Abbreviation: AUC, area under the receiver operating characteristics curve.
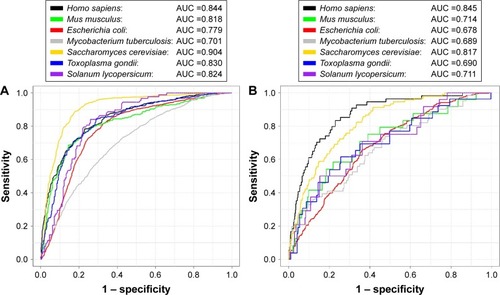
Table 4 The AUC values of cross-species prediction for combined model over fivefold cross-validation test