Figures & data
Table 1 Characterization of PTX/DOX–LCP with different prescriptions (n=3)
Figure 1 TEM images of SPS nanospheres (A), HCP (B), and LCP (C). Magnification ×30,000.
Abbreviations: TEM, transmission electron microscopy; SPS, sulfonated polystyrene nanospheres; HCP, hollow calcium phosphate; LCP, lipid-coated hollow calcium phosphate.
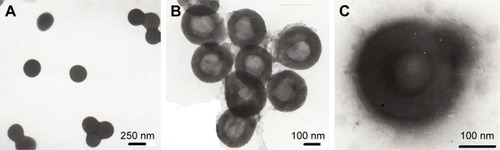
Table 2 IC50, CI50, and DRI of different compositions to A549 cells
Figure 2 (A) Cell viability of LCP at various concentrations and (B) cell inhibition rate of PTX/DOX–LCP and DOX/PTX.
Abbreviations: LCP, lipid-coated hollow calcium phosphate; DOX, doxorubicin; PTX, paclitaxel.
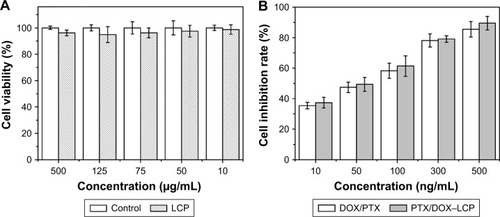
Figure 3 (A) In vitro drug-release curves of PTX/DOX–LCP powders. (B–D) The PXRD patterns, DSC patterns, and FT-IR spectra of PTX, DOX, HCP, LCP, PTX–LCP, DOX–LCP, and the physical mixture (PM) with the same proportion of PTX/DOX–LCP and PTX/DOX–LCP.
Abbreviations: LCP, lipid-coated hollow calcium phosphate; DOX, doxorubicin; PTX, paclitaxel; PXRD, powder X-ray diffractometer; DSC, differential scanning calorimeter; FT-IR, Fourier-transform infrared; HCP, hollow calcium phosphate.
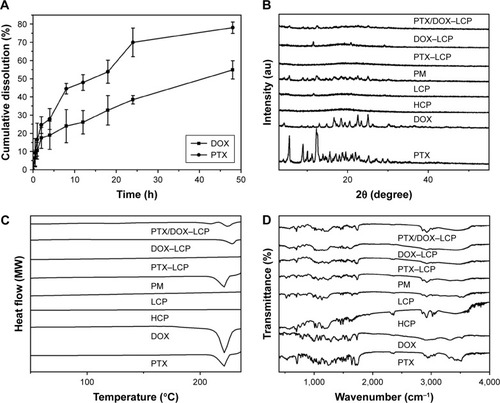
Figure 4 Apoptosis rate images of the control, DOX/PTX, and PTX/DOX–LCP groups.
Abbreviations: LCP, lipid-coated hollow calcium phosphate; DOX, doxorubicin; PTX, paclitaxel.
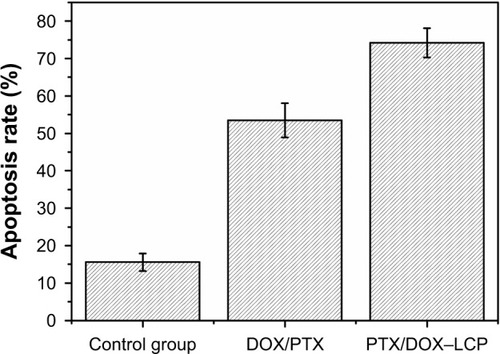
Figure 5 The flow cytometry images of the control group (A), DOX/PTX group (B), and PTX/DOX–LCP group (C).
Abbreviations: LCP, lipid-coated hollow calcium phosphate; DOX, doxorubicin; PTX, paclitaxel.
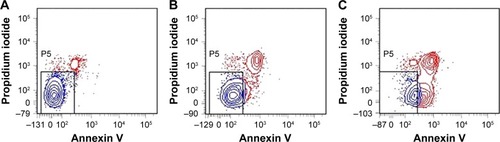
Figure 6 The CLSM images of A549 cells treated with FITC-LCP at various time periods (A) and at various concentrations (B). Magnification ×600.
Abbreviations: CLSM, confocal laser scanning microscopy; FITC, fluorescein isothiocyanate; LCP, lipid-coated hollow calcium phosphate.
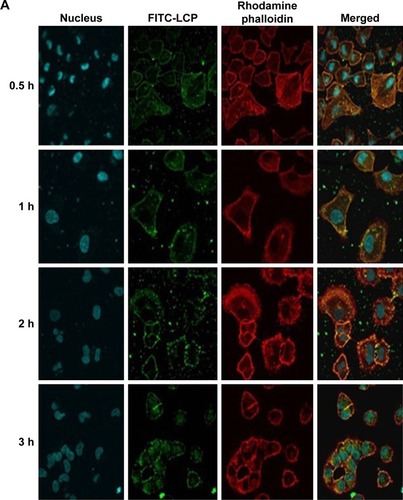
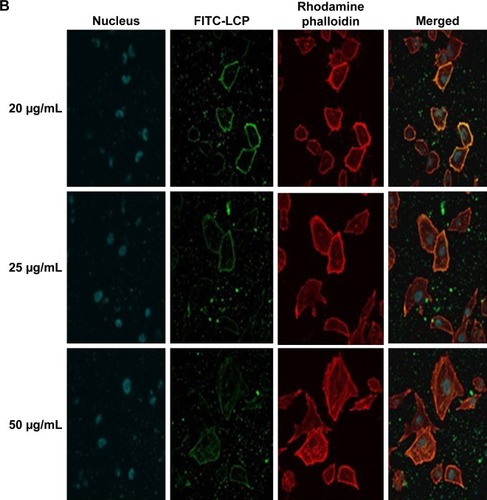
Figure 7 TEM images of FITC-LCP not taken up (A) and intracellular uptake in A549 cells (B). Magnification ×20,000.
Note: Arrows point at microfilaments.
Abbreviations: FITC, fluorescein isothiocyanate; LCP, lipid-coated hollow calcium phosphate; TEM, transmission electron microscopy.
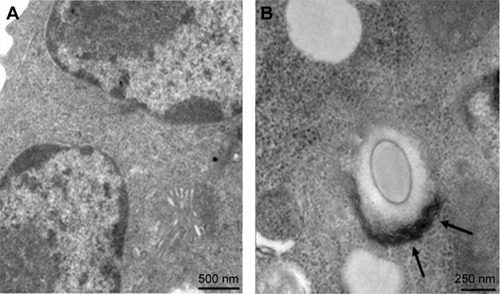
Figure 8 (A) The tumor volume curves of the saline, DOX/PTX, and PTX/DOX–LCP groups. (B) The images of tumor tissues excised from the tumor-bearing nude mice of the saline, DOX/PTX, and PTX/DOX–LCP groups.
Abbreviations: LCP, lipid-coated hollow calcium phosphate; DOX, doxorubicin; PTX, paclitaxel.
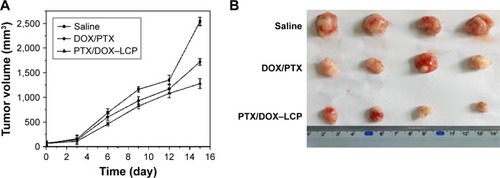
Figure 9 Histological examination of excised tumor tissues of the saline, DOX/PTX, and PTX/DOX–LCP groups under different magnification.
Abbreviations: LCP, lipid-coated hollow calcium phosphate; DOX, doxorubicin; PTX, paclitaxel.
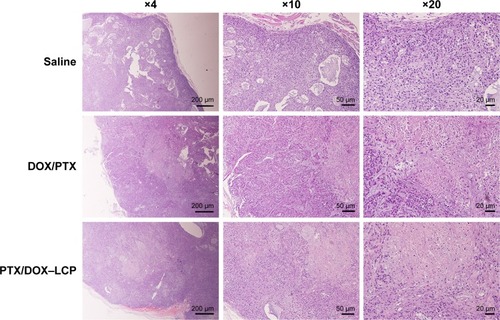
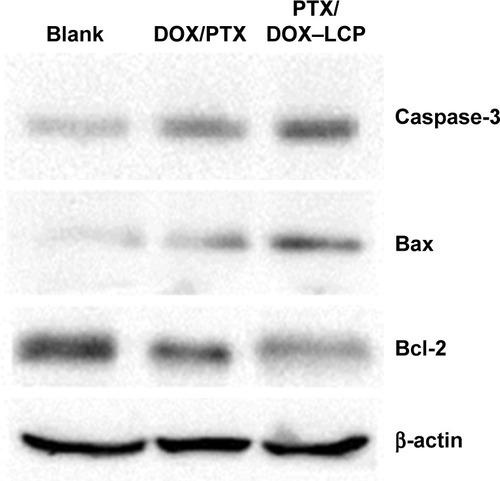
Figure 10 Images of Bax, Bcl-2, and Caspase-3 protein expression levels of the blank, DOX/PTX, and PTX/DOX–LCP groups.
Abbreviations: LCP, lipid-coated hollow calcium phosphate; DOX, doxorubicin; PTX, paclitaxel.