Figures & data
Table 1 Particle size and zeta potential measurements of GO and rGO
Figure 1 Characterization of GO and rGO nanosheets.
Notes: AFM characterization of the surface topography of (A) GO and (B) rGO. Raman spectroscopy of (C) GO and (D) rGO.
Abbreviations: GO, graphene oxide; rGO, reduced graphene oxide; AFM, atomic force microscopy.
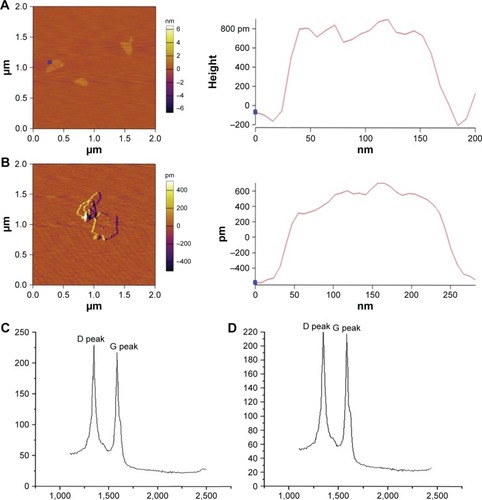
Figure 2 GO and rGO nanosheets-induced alterations in PC12 cell viability.
Notes: PC12 cells were treated with GO and rGO nanosheets at doses of 0, 10, 20, 40, 60, 80, or 100 µg/mL for 6, 12, 24, or 48 h. Cell viability was determined using the CCK-8 assay: (A) GO NPs and (B) rGO NPs. The results are presented as the mean ± SEM from three independent experiments. *P<0.05, **P<0.01, and ***P<0.001.
Abbreviations: Ctrl, control; GO, graphene oxide; rGO, reduced graphene oxide; CCK-8, cell counting kit-8; NPs, nanoparticles.
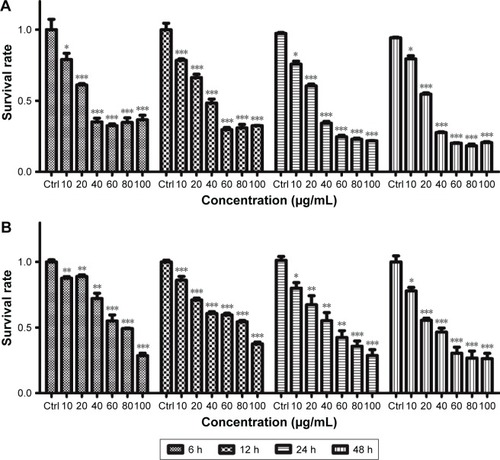
Figure 3 GO and rGO nanosheets-induced PC12 cell apoptosis.
Notes: PC12 cells were treated with GO and rGO nanosheets at doses of 0, 50, or 100 µg/mL for 24 h: (A and E) control; (B and C) PC12 cells treated with 50 or 100 µg/mL GO NPs. (D) Relative cell death after GO treatment. (F and G) PC12 cells treated with 50 or 100 µg/mL rGO NPs. (H) Relative cell death after rGO treatment.
Abbreviations: Ctrl, control; GO, graphene oxide; rGO, reduced graphene oxide; NPs, nanoparticles; PI, propidium iodide.
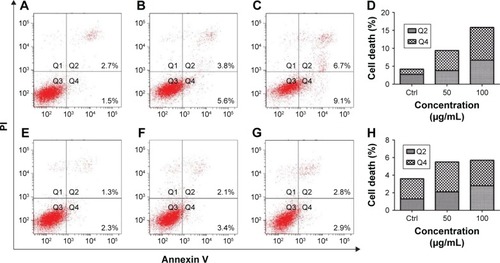
Figure 4 GO and rGO induce PC12 cell cycle arrest.
Notes: (A–D) PC12 cells treated with GO nanosheets at 0, 10, 20, or 50 µg/mL for 24 h. (E–H) PC12 cells treated with rGO nanosheets at 0, 10, 20, or 50 µg/mL for 24 h. (I and J) Cell cycle analysis after GO and rGO treatment, respectively.
Abbreviations: Ctrl, control; GO, graphene oxide; rGO, reduced graphene oxide; PI–A, propidium iodide–Annexin V.
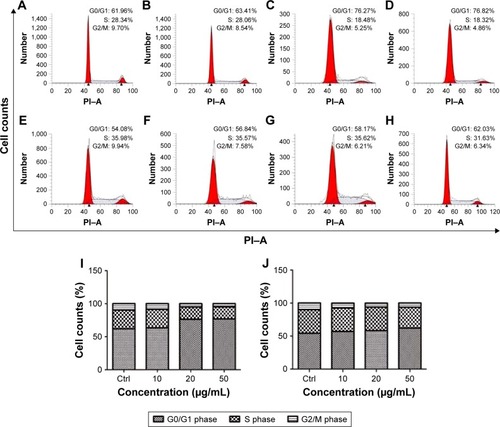
Figure 5 Confocal microscopy analysis of GO- and rGO-induced PC12 cell cycle arrest.
Notes: PC12 cells were treated with 50 µg/mL GO and rGO for 24 h. Cells were stained with rhodamine-phalloidin (red) and Hoechst 33342 (blue). Scale bar represents 50 µm.
Abbreviations: GO, graphene oxide; rGO, reduced graphene oxide.
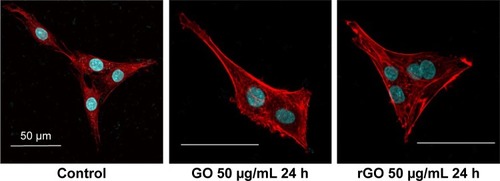
Figure 6 ERK phosphorylation levels after treatment with GO nanosheets.
Notes: PC12 cells were treated with GO nanosheets at a dose of 50 µg/mL for 30 min or 1, 3, 6, 12, or 24 h. Total proteins were extracted, and the phosphorylation levels of ERK signaling pathway molecules were analyzed via Western blot. The results are presented as the mean ± SEM from three independent experiments. *P<0.05, **P<0.01, and ***P<0.001 compared with the control.
Abbreviations: Ctrl, control; GO, graphene oxide.
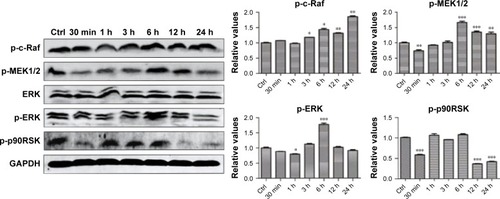
Figure 7 ERK phosphorylation levels after treatment with rGO nanosheets.
Notes: PC12 cells were treated with rGO nanosheets at a dose of 50 µg/mL for 30 min or 1, 3, 6, 12, or 24 h. Total proteins were extracted, and the phosphorylation levels of ERK signaling pathway molecules were analyzed via Western blot. The results are presented as the mean ± SEM from three independent experiments. **P<0.01, and ***P<0.001 compared with the control.
Abbreviations: Ctrl, control; rGO, reduced graphene oxide.
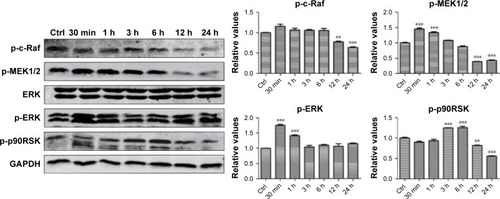
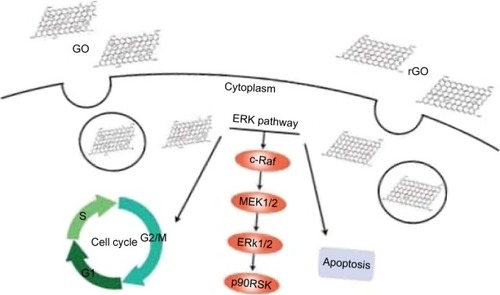
Figure 8 Schematic diagram of the GO and rGO nanosheets-induced effects on PC12 cell cycle arrest and apoptosis.
Note: Graphene nanosheets are endocytosed and activate the ERK signaling pathway to regulate the cell cycle and to induce apoptosis.
Abbreviations: GO, graphene oxide; rGO, reduced graphene oxide.