
Figures & data
Table 1 Summary of physicochemical properties of the nanocarriers
Figure 1 FEG-SEM image of PLGA nanoparticles.
Abbreviations: FEG-SEM, field emission gun-scanning electron microscope; PLGA, poly(lactic-co-glycolic) acid.
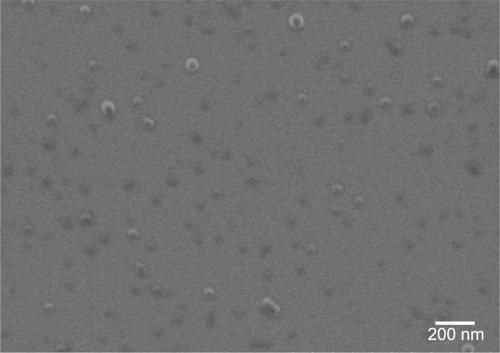
Table 2 Measured zeta potentials of PLGA nanoparticles, depending on their load and surface functionalization
Table 3 In vitro IC50 of BM in different nanocarriers, measured with the fluorogenic DBOMF probe, after 3 hours of co-incubation on HepaRG cells; results are the mean of at least three independent experiments performed in triplicate, presented with 95% confidence interval
Figure 2 In vivo imaging of mice injected with (A) micelles of (i) PS80–EtOH DilC18, (ii) DSPE-PEG DilC18, (iii) DSPE-PEG lactosyl DilC18, (B) nanoparticles of (i) PLGA DilC18, (ii) PLGA-Ga DilC18 and (iii) HA DilC18, with solutions on the same scale of fluorescence, 10 minutes after injection. At least three mice per condition were imaged in vivo. Scales: radiant efficiency in (p/second/cm2/sr)/(µW/cm2); min =7.02E7; max =4.14E9. (C) Ex vivo imaging of livers and spleens of mice injected with (i) PLGA DilC18, (ii) PLGA-Ga DilC18 and (iii) HA DilC18 1 hour after injection. At least two mice per condition were imaged. Scales: radiant efficiency in (p/second/cm2/sr)/(µW/cm2); min =1.11E8; max =6.5E8.
Abbreviations: DilC18, 1,1′-dioctadecyl-3,3,3′,3′-tetramethylindodicarbocyanine; DSPE-PEG, 1,2-Distearoyl-sn-glycero-3-phosphoethanolamine-N-(carboxy(polyethylene glycol)-2000); EtOH, ethanol; Ga, galactosamine; PLGA, poly(lactic-co-glycolic) acid; PLGA-Ga, PLGA nanoparticles functionalized with Ga; HA, hyaluronic acid; PS80, polysorbate 80.
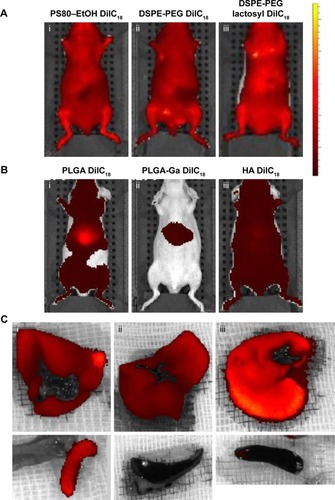
Figure 3 FACS analysis of hepatocytes (A) 1 hour after mice injected with (i) PS80–EtOH DilC18, (ii) PLGA DilC18, (iii) HA DilC18 or (iv) PLGA-Ga DilC18 and (B) 20 hours after mice injected with (i) HA DilC18 or (ii) PLGA-Ga DilC18.
Notes: FITC-positive population (FITC+) represents hepatocytes, due to their autofluorescence at this wavelength. The population in the upper right corner is the APC-positive hepatocytes (APC+/FITC+): hepatocytes after DilC18 uptake.
Abbreviations: DilC18, 1,1′-dioctadecyl-3,3,3′,3′-tetramethylindodicarbocyanine; FACS, fluorescence-activated cell sorting (flow cytometry); EtOH, ethanol; FITC, fluorescein isothiocyanate; Ga, galactosamine; HA, hyaluronic acid; PLGA, poly(lactic-co-glycolic) acid; PLGA-Ga, PLGA nanoparticles coated with Ga; PS80, polysorbate 80.
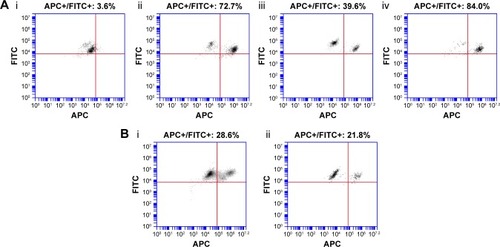
Figure 4 (A) Median tumor volume (mm3) (n=4 for groups 1–2, n=6 for groups 3–5), (B) individual tumor volume (mm3) of groups 1–2 and 4–5, (C) individual tumor volume (mm3) of groups 1–2, 3 and 5, (D) Kaplan–Meier diagram of groups 1–2 and 4–5, and (E) Kaplan–Meier diagram of groups 1–2, 3 and 5. Difference between the PLGA-Ga BM and docetaxel alone groups was evaluated with a two-way ANOVA analysis and a Bonferroni post test, ***P-value <0.001. Arrows: injections (gray arrow PS80–EtOH BM or PLGA-Ga BM injections and black arrow docetaxel injections).
Abbreviations: BM, bergamottin; EtOH, ethanol; Ga, galactosamine; PLGA, poly(lactic-co-glycolic) acid; PLGA-Ga, PLGA nanoparticles functionalized with Ga; PS80, polysorbate 80.
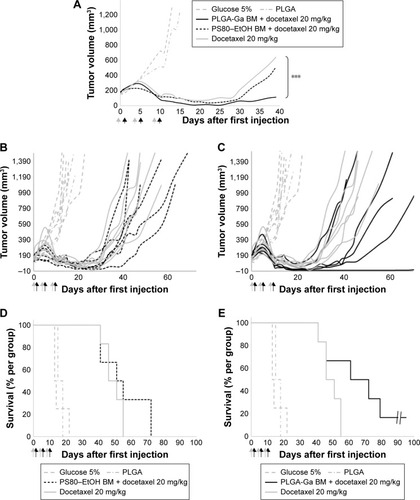
Figure S1 (A) Schematic representation of the nanocarriers and synthesis process of (B) PS80 micelles, (C) DSPE-PEG micelles, (D) PLGA nanoparticles and (E) HA nanoparticles.
Abbreviations: DSPE-PEG, 1,2-Distearoyl-sn-glycero-3-phosphoethanolamine-N-(carboxy(polyethylene glycol)-2000); EDC, 1-ethyl-3-(3-dimethlyaminopropyl) carbodiimide; HA, hyaluronic acid; lactosyl-PE, 1,2-dioleoyl-sn-glycero-3-phosphoethanolamine-N-lactosyl; NHS, N-hydroxysulfosuccinimide; PLGA, poly(lactic-co-glycolic) acid; PS80, polysorbate 80.
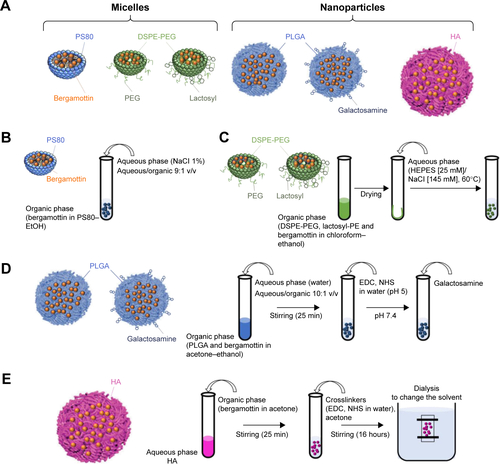
Figure S2 Schematic representation of the functionalization of PLGA nanoparticles with galactosamine.
Abbreviations: BM, bergamottin; EDC, 1-ethyl-3-(3-dimethlyaminopropyl) carbodiimide; NHS, N-hydroxysulfosuccinimide; PLGA, poly(lactic-co-glycolic) acid.
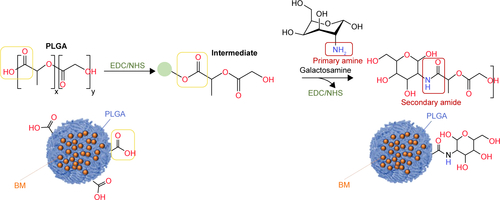
Figure S3 Favored intake of coated nanoparticles by HepaRG cells seen with Zeiss LSM710 confocal microscope with fixed optical parameters after 20 minutes (A, B), 3 hours (C, D) or 24 hours (E, F) of in vitro incubation of coated PLGA-Ga nanoparticles (A, C, E) or uncoated PLGA nanoparticles (B, D, F).
Notes: Fixed cells were imaged on a Zeiss confocal LSM710 microscope. Images were acquired using the 63× objective in oil, as 12-bit images. To image DilC18, DsRed filters were used and the Zeiss confocal LSM710 microscope was set as follows: masgain =600; digital gain =1.0; laser line (561 nm): 15%. Cell nuclei were stained with 4′,6-diamidino-2-phenylindole (DAPI). Master gain =600; digital gain =1.0; laser line (561 nm): 15%.
Abbreviations: PLGA, poly(lactic-co-glycolic) acid; PLGA-Ga, PLGA nanoparticles functionalized with galactosamine.
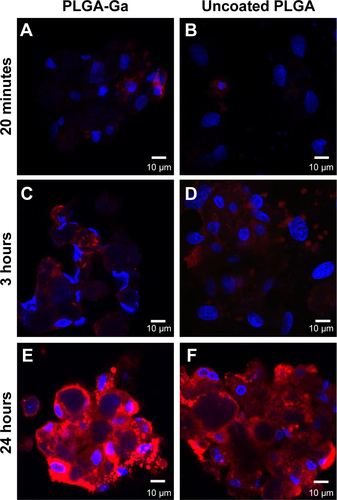
Figure S4 In vitro uptake of nanoparticles by HepaRG cells seen with confocal microscope (Zeiss LSM710) using the 63× objective in oil.
Notes: Uptake of (A) coated DSPE-PEG micelles with lactosyl containing 27 mg/L of DilC18 and (B) uncoated DSPE-PEG micelles containing 27 mg/L of DilC18 after 3 hours of in vitro incubation on HepaRG cells. Images were acquired with identical optical parameters (master gain =600; digital gain =1.0; laser line [561 nm]: 15%) and after DAPI staining of the nuclei and fixation of HepaRG cells.
Abbreviations: DAPI, 4′,6-diamidino-2-phenylindole; DilC18, 1,1′-dioctadecyl-3,3,3′,3′-tetramethylindodicarbocyanine; DSPE-PEG, 1,2-Distearoyl-sn-glycero-3-phosphoethanolamine-N-(carboxy(polyethylene glycol)-2000).
![Figure S4 In vitro uptake of nanoparticles by HepaRG cells seen with confocal microscope (Zeiss LSM710) using the 63× objective in oil.Notes: Uptake of (A) coated DSPE-PEG micelles with lactosyl containing 27 mg/L of DilC18 and (B) uncoated DSPE-PEG micelles containing 27 mg/L of DilC18 after 3 hours of in vitro incubation on HepaRG cells. Images were acquired with identical optical parameters (master gain =600; digital gain =1.0; laser line [561 nm]: 15%) and after DAPI staining of the nuclei and fixation of HepaRG cells.Abbreviations: DAPI, 4′,6-diamidino-2-phenylindole; DilC18, 1,1′-dioctadecyl-3,3,3′,3′-tetramethylindodicarbocyanine; DSPE-PEG, 1,2-Distearoyl-sn-glycero-3-phosphoethanolamine-N-(carboxy(polyethylene glycol)-2000).](/cms/asset/57bf7d84-54dc-42ed-ac80-94795e4d3f5c/dijn_a_12193733_sf0004_c.jpg)
Figure S5 In vivo imaging of a mouse injected with DilC18 in H2O-EtOH (1:1 v/v).
Notes: Presented images were taken 1 minute, 5 minutes, 30 minutes and 60 minutes after intravenous injection in the tail vein. Scale: min =7.00E7; max =2.00E8 radiant efficiency in (p/second/cm2/sr)/(µW/cm2).
Abbreviations: DilC18, 1,1′-dioctadecyl-3,3,3′,3′-tetramethylindodicarbocyanine; EtOH, ethanol.
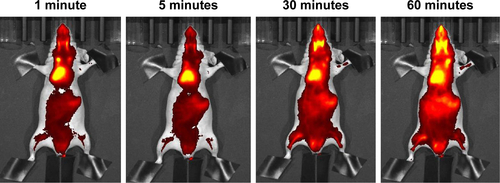
Figure S6 In vivo imaging of mice injected with (A) PS80–EtOH DilC18, (B) DSPE-PEG DilC18, (C) DSPE-PEG lactosyl DilC18, (D) HA DilC18, (E) PLGA DilC18 and (F) PLGA-Ga DilC18.
Notes: Presented images were taken approximately every 2 minutes until 15 minutes, every 4 minutes from 15 minutes to 30 minutes and every 7 minutes from 30 minutes to 1 hour. At least three mice per condition were imaged. Scale: min =7.02E7; max =4.14E9 radiant efficiency in (p/second/cm2/sr)/(µW/cm2).
Abbreviations: DilC18, 1,1′-dioctadecyl-3,3,3′,3′-tetramethylindodicarbocyanine; DSPE-PEG, 1,2-Distearoyl-sn-glycero-3-phosphoethanolamine-N-(carboxy(polyethylene glycol)-2000); EtOH, ethanol; HA, hyaluronic acid; PLGA, poly(lactic-co-glycolic) acid; PLGA-Ga, PLGA nanoparticles coated with galactosamine; PS80, polysorbate 80.
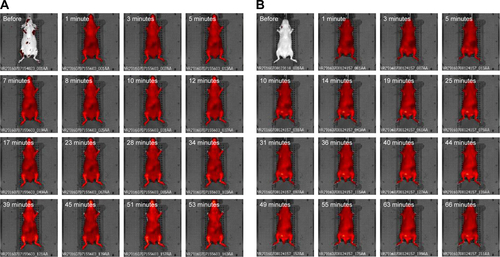
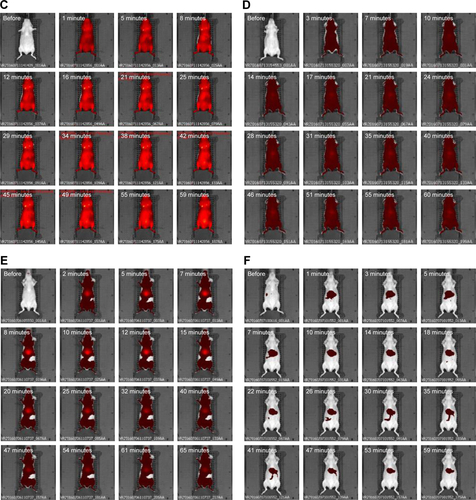
Figure S7 In vivo imaging of mice injected with (A) HA DilC18, (B) PLGA DilC18 and (C) PLGA-Ga DilC18, at lowered concentration of nanoparticles (0.25 g/L of polymer).
Notes: Presented images were taken approximately every 2 minutes until 15 minutes, every 4 minutes from 15 minutes to 30 minutes and every 7 minutes from 30 minutes to 1 hour. At least three mice per condition were imaged. Scale: min =7.02E7; max =4.14E9 radiant efficiency in (p/second/cm2/sr)/(µW/cm2).
Abbreviations: DilC18, 1,1′-dioctadecyl-3,3,3′,3′-tetramethylindodicarbocyanine; HA, hyaluronic acid; PLGA, poly(lactic-co-glycolic) acid; PLGA-Ga, PLGA nanoparticles coated with galactosamine.
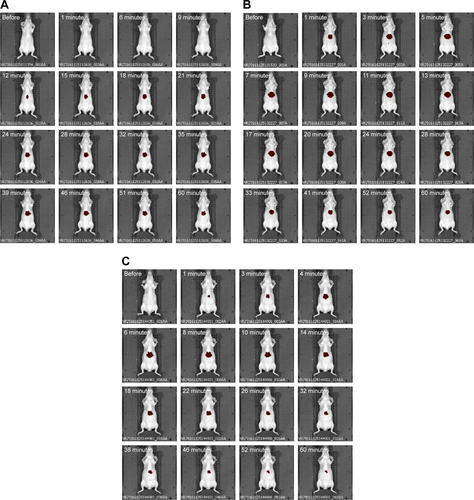
Figure S8 In vitro control of MDA-MB-231 cells sensitization to docetaxel by BM.
Notes: Cell sensitization to docetaxel diluted in NaCl 1% (1:9 v/v) prior to injection was measured using a WST-1 assay according to the manufacturer’s instructions, after 48 hours of co-incubation of BM (0–5 µM) and docetaxel (0–25 nM) in cell culture medium. A statistical analysis was performed by a two-way analysis of variance (ANOVA) analysis (Prism software). The concentration in BM did not cause significant differin the response of MDA-MB-231 cells to docetaxel. As measured by WST-1, MDA-MB-231 cells were not sensitized to docetaxel in vitro, by the co-incubation with polysorbate 80 (PS80)-EtOH BM micelles for 48 hours. In vitro viability of MDA-MB-231 cells after a 48-hour co-incubation of PS80–EtOH BM (0 µM, 0.2 µM, 1 µM and 5 µM) and docetaxel, evaluated by WST-1 assay. Results are the mean of triplicates ± SD, presented with a statistical analysis (two-way ANOVA, Prism software).
Abbreviations: BM, bergamottin; EtOH, ethanol; PS80, polysorbate 80.
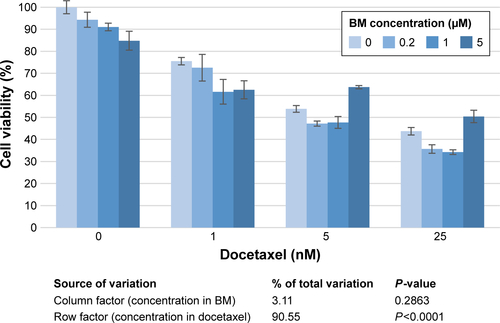
Figure S9 Relative mean weight evolution per treatment group, relative to the mean weight per group at the first day of injection, ±SD.
Notes: No difference in weight evolution was noted between treated groups. No significant weight loss was observed.
Abbreviations: BM, bergamottin; EtOH, ethanol; PLGA, poly(lactic-co-glycolic) acid; PLGA-Ga, PLGA nanoparticles functionalized with galactosamine; PS80, polysorbate 80.
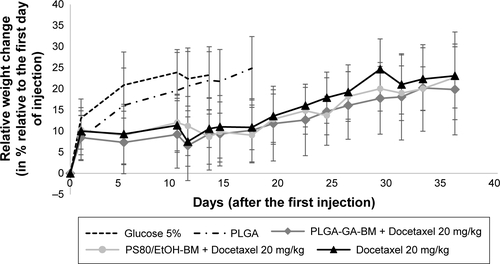
Table S1 Treatment groups for in vivo study: antitumor efficacy