Figures & data
Figure 1 GNS morphology by TEM (A); visualization and quantification of GNS endocytosed into SUM149 cell line (B–E). The relative amount of cellular uptake of 0.15 nM GNS after 24-hour incubation was observed by TEM. TEM images show GNS in cytoplasmic vesicles (red arrows) as well as GNS adhered to the cellular membrane (yellow arrows). TEM imaging revealed that the majority of the nanoparticles were localized within the cytoplasmic space and the vesicles of the cells and that no nanoparticles were observed to be present within the nuclear membrane (N, nucleus) of the cell (D). (E) Nanoparticle uptake per cell over a time course of 1, 4, 8, and 24 hours of particle incubation with SUM149 cell line was quantified by ICP-OES. SUM149 cells demonstrated consistent nanoparticle uptake and cytoplasmic retention over a 24-hour period.
Abbreviations: GNS, gold nanostars; TEM, transmission electron microscopy.
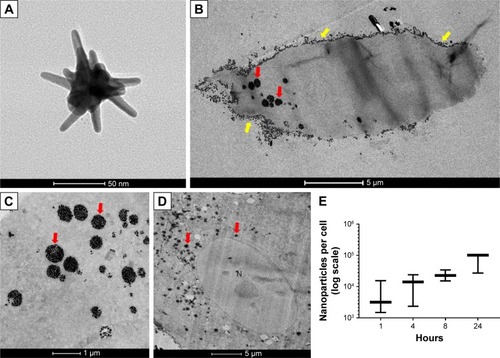
Figure 2 GNS uptake in IBC (SUM149 & SUM190) and non-IBC (BT474M1 & MDA-MB-231) cell lines. Receptor statuses are provided beneath each represented cell line. The cell lines were incubated with 0.15 nM GNS for 24 hours, washed to remove free particles, stained with Hoechst 33342, and imaged via MPM. The GNS appear as black particles within the cells under phase-contrast imaging (yellow arrows; scale bars =100 μm). Under MPM, the GNS in the cell cytoplasm appear white in color.
Abbreviations: GNS, gold nanostars; MPM, multiphoton microscopy; IBC, inflammatory breast cancer.
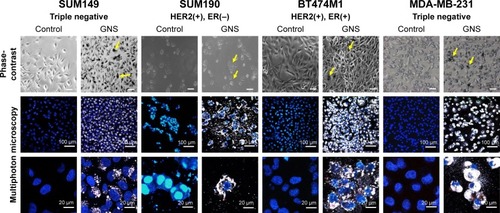
Figure 3 The effects of increasing concentrations of GNS on SUM149 proliferation and viability following nanoparticle incubation at 1, 6, 12, and 24 hours as determined by MTT (A) and resazurin-based assays (B), respectively. SUM149 cells were incubated with nanoparticles at concentrations of 0.05, 0.10, 0.15, and 0.20 nM. After all time points were met, MTT or resazurin assays were performed. Representative phase-contrast images of the experimental groups immediately prior to the addition of MTT or resazurin reagent are shown (scale bars =100 μm). MTT assays showed minor decreases in cell proliferation at 6, 12, and 24 hours of GNS incubation, whereas resazurin assays showed a larger decrease in cell viability at 24 hours for all nanoparticle concentrations. The effects of GNS on cell proliferation and viability never precluded the experimental use of GNS-labeled cells.
Abbreviations: GNS, gold nanostars; MTT, (3-(4, 5-dimethylthiazolyl-2)-2, 5-diphenyltetrazolium bromide).
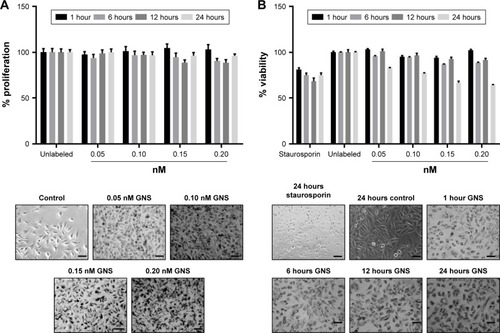
Figure 4 Photothermolysis of IBC (SUM149 and SUM190) and non-IBC (BT474M1 and MDA-MB-231) cell lines. Cells were incubated with 0.15 nM GNS for 24 hours, washed to remove free particles, and exposed to an 800 nm multiphoton pulsed laser for 3 minutes at various laser intensities. Following laser exposure, cells were stained with fluorescein diacetate (live = green) and propidium iodide (dead = red) to determine relative cell viability. An empty region of cells is representative of the treatment area where cells detached from the plate’s surface. The most effective degree of irradiation was determined to be 3.7 mW, yielding the most specific area of cellular ablation. For all cell lines tested, the control samples (cells without GNS, ie, unlabeled) displayed full viability following photothermal treatment. All samples were plated in 35 mm Petri dishes. Scale bars are 100 μm.
Abbreviations: GNS, gold nanostars; IBC, inflammatory breast cancer.
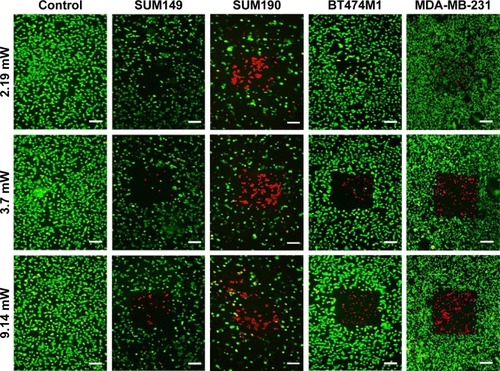
Figure 5 GNS are endocytosed by SUM149 (A, B) and SUM190 (C, D) tumor emboli, after which they penetrate into the tumor embolic core. Tumor emboli shown here are imaged after 96 hours of embolic maturation. The control groups represent cells that are free of nanoparticles. For GNS-labeled emboli, nanoparticles were added after 96 hours of embolic maturation. Following 24 hours of GNS incubation, samples were stained with Hoechst 3342 and imaged with MPM. The black portions, as shown by yellow arrows, represent GNS as observed by phase-contrast microscopy. GNS as observed by MPM is shown by white luminescence. H&E staining displays the cross-sectional area of the emboli, and MPM imaging of the cross-section further demonstrates the depth of GNS penetrance into the tumor embolic core (scale bars =100 μm). (B, D) 2D projections of the GNS-labeled tumor emboli depicted in A and C. Shown here are the individual Z slices of the stacked composite image. This projection demonstrates the depth of GNS penetrance into the tumor emboli.
Abbreviations: GNS, gold nanostars; MPM, multiphoton microscopy; H&E, hematoxylin and eosin.
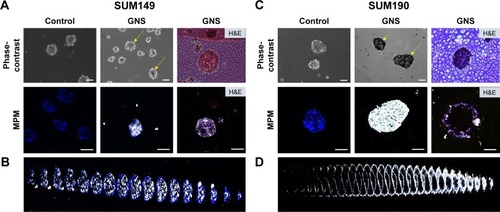
Figure 6 Photothermal treatment of SUM149 (A) and SUM190 (B) tumor emboli. After 96 hours of tumor emboli maturation, 0.15 nM of GNS was incubated with tumor emboli for 24 hours. Following GNS incubation, samples were exposed to an 808 nm continuous laser at various laser intensities. After treatment, the experimental samples were stained with propidium iodide to illustrate any cellular death that occurred following laser irradiation. All emboli that were incubated with GNS exhibited cell death following laser exposure. Control samples were treated with the same level of irradiation, which demonstrated virtually no cell death. Representative phase-contrast images of each sample following treatment are shown. Empty spaces seen under phase-contrast for GNS-labeled emboli are due to the repositioning of the emboli in the wells following photothermal treatment. The GNS-labeled emboli appear in black color under phase-contrast imaging due to GNS uptake, compared to the unlabeled controls (scale bars =100 μm).
Abbreviation: GNS, gold nanostars.
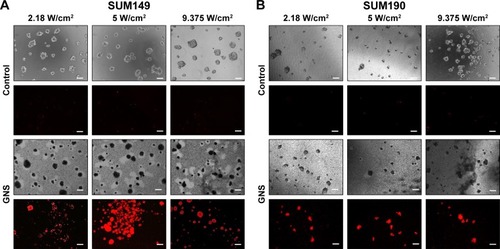
Figure 7 GNS uptake and photothermal ablation in drug-resistant IBC cell line rSUM149. (A) The drug-resistant IBC variant, rSUM149, was incubated with 0.15 nM GNS for 24 hours, stained with Hoechst 33342 and imaged by MPM. The GNS in the cells appear as black particles as observed by phase-contrast imaging (yellow arrows), whereas the GNS in the cytoplasm appear as white luminiscence under MPM. (B) Photothermolysis of rSUM149 cell line. Cells were incubated with 0.15 nM GNS for 24 hours and then exposed to a multiphoton pulsed laser for 3 minutes at various laser intensities. Following laser exposure, cells were stained with fluorescein diacetate (live = green) and propidium iodide (dead = red) to determine relative cell viability. The control samples (cells without GNS, ie, unlabeled) displayed full viability following photothermal treatment (scale bars =100 μm). (C) GNS penetrate rSUM149 tumor emboli. Tumor emboli shown here are imaged after 96 hours of embolic maturation. The control groups represent cells that are free of nanoparticle. For GNS-labeled emboli, nanoparticles were added after 96 hours of embolic maturation. Following 24 hours of GNS incubation, samples were stained with Hoechst 3342 and imaged with MPM. The black portions, shown by yellow arrows, represent GNS as observed by phase-contrast microscopy, whereas white luminescence represents GNS as observed by MPM (scale bars =100 μm). A 2D projection of the GNS-labeled tumor emboli is shown where individual Z slices of the stacked composite image are displayed. This projection demonstrates the depth of GNS penetrance into the tumor emboli. H&E staining displays the cross-sectional area of the emboli; MPM imaging of the cross-section further demonstrates the depth of GNS penetrance into the tumor embolic core. (D) Photothermal treatment of rSUM149 tumor emboli. Following GNS incubation, samples were exposed to an 808 nm continuous laser at various laser intensities. After treatment, the experimental samples were stained with propidium iodide to illustrate any cellular death that occurred following laser irradiation. All emboli that were incubated with GNS exhibited cell death following laser exposure. Control samples were treated with the same level of irradiation, which demonstrated virtually no cell death. Representative phase-contrast images of each sample are shown following treatment. Empty spaces seen under phase-contrast imaging for GNS-labeled emboli are due to the repositioning of the emboli following photothermal treatment. The GNS-labeled emboli appear in black color under phase-contrast imaging due to GNS uptake, compared to the unlabeled controls (scale bars =100 μm).
Abbreviations: GNS, gold nanostars; H&E, hematoxylin and eosin; MPM, multiphoton microscopy.
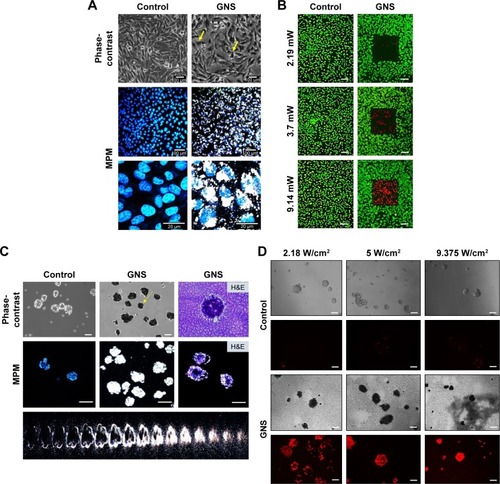
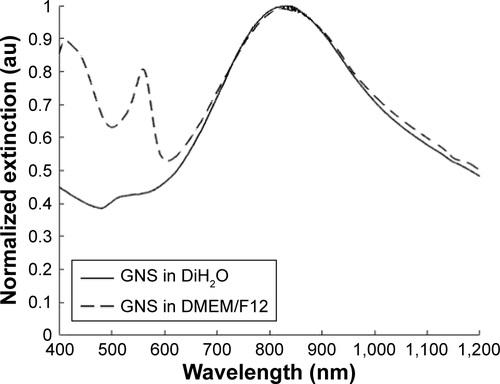
Figure S1 Normalized extinction spectra of GNS in distilled water (DiH2O, solid line) and in DMEM/F12 media (dashed line) after 24 hours of incubation. No shift was observed for the GNS absorption peak (located at 830 nm) when incubating in DMEM/F12 for 24 hours, indicating that the nanoparticles were stable in cell culture medium. Peaks observed at 560 nm and 440 nm are due to the presence of DMEM/F12 medium.
Abbreviations: DMEM/F12, Dulbecco’s Modified Eagle’s Medium: Nutrient Mixture F-12; GNS, gold nanostars.