Figures & data
Table 1 TPP for the development of nanocrystals of ACF
Table 2 Risk assessment matrix elucidating the effect of CMAs and CPPs on product attributes
Table 3 Variables in Box-Behnken design to form ACF nano-crystals
Table 4 Composition and responses of nanocrystals of ACF
Figure 1 Three-dimensional plots showing the effect of independent variables on particle size.
Notes: (A) Effect of concentration of stabilizer and size of the balls on particle size; (B) Effect of concentration of stabilizer and amount of drug on particle size; (C) Effect of amount of drug and milling time on particle size; (D) Effect of milling time and size of the balls on particle size; (E) Effect of milling time and concentration of stabilizer on particle size; (F) Effect of amount of drug and size of the balls on particle size.
Abbreviation: conc, concentration.
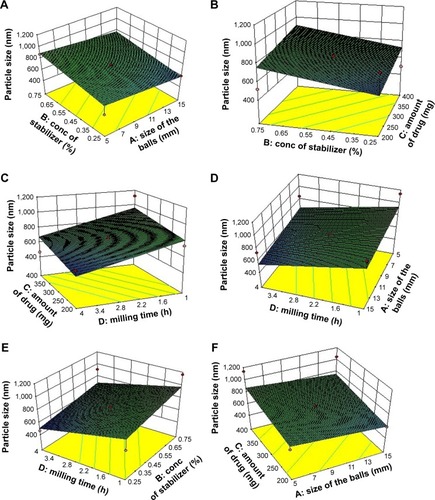
Figure 2 Three-dimensional plots showing the effect of independent variables on PDI.
Notes: (A) Effect of concentration of stabilizer and size of the balls on PDI; (B) Effect of concentration of stabilizer and amount of drug on PDI; (C) Effect of amount of drug and milling time on PDI; (D) Effect of milling time and size of the balls on PDI; (E) Effect of milling time and concentration of stabilizer on PDI; (F) Effect of amount of drug and size of the balls on PDI.
Abbreviations: conc, concentration; PDI, polydispersity index.
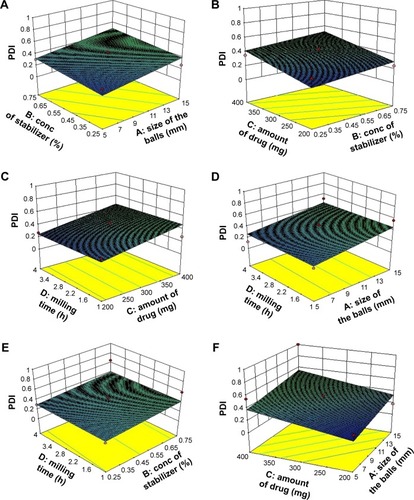
Figure 3 Three-dimensional plots showing the effect of independent variables on zeta potential.
Notes: (A) Effect of concentration of stabilizer and size of the balls on zeta potential; (B) Effect of concentration of stabilizer and amount of drug on zeta potential; (C) Effect of amount of drug and milling time on zeta potential; (D) Effect of milling time and size of the balls on zeta potential; (E) Effect of milling time and concentration of stabilizer on zeta potential; (F) Effect of amount of drug and size of the balls on zeta potential.
Abbreviation: conc, concentration.
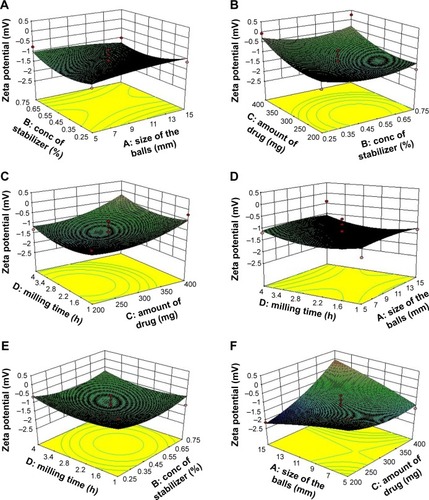
Table 5 Comparative values for observed and predicted results
Figure 4 Design space of ACF nanocrystals comprised of the overlap region of ranges for the different critical quality attributes.
Abbreviations: ACF, aceclofenac; PDI, polydispersity index.
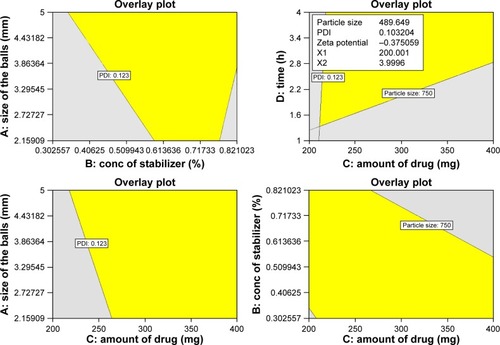
Figure 5 X-ray diffraction patterns for (A) pure unmilled ACF and (B) ACF nanocrystals.
Abbreviation: ACF, aceclofenac.
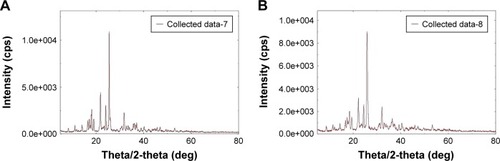
Figure 6 Differential scanning calorimetric (DSC) thermograms for (A) unmilled ACF (B) physical mixture of unmilled ACF + PVA and (C) ACF nanocrystals.
Abbreviations: ACF, aceclofenac; DSC, differential scanning calorimetric; PVA, polyvinyl alcohol.
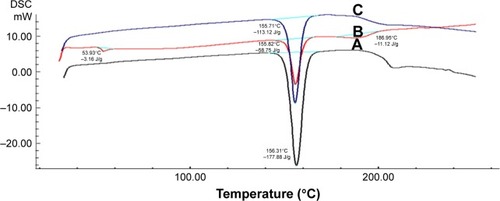
Figure 7 Scanning electron microscopy images of (A) unmilled ACF (B) ACF nanocrystals.
Abbreviation: ACF, aceclofenac.
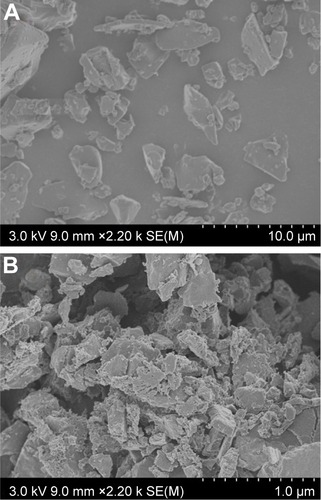
Figure 8 Saturation solubility studies of pure ACF and ACF nanocrystals.
Abbreviation: ACF, aceclofenac.
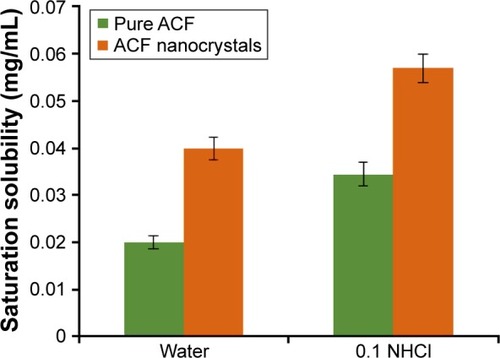
Figure 9 In vitro release profile of pure ACF and ACF nanocrystals.
Abbreviation: ACF, aceclofenac.
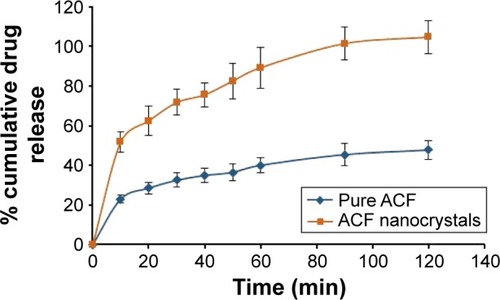
Table 6 Pharmacokinetic parameters for pure ACF and ACF nanocrystals
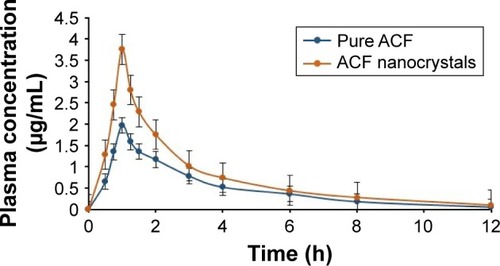
Figure 10 Plasma concentration-time profile for pure ACF and ACF nanocrystals.
Abbreviation: ACF, aceclofenac.