Figures & data
Table 1 Nanoparticle characterization
Figure 1 Electron micrography of cells exposed to maghemite–rhodium citrate nanoparticles (MRC NPs) for 6 hours.
Notes: Human nontumor mesenchymal cells (HNTMC) in first column showing some MRC NPs (indicated by red arrows) inside the cytoplasm (A, D), and a substantial amount of NPs surrounding the cell membrane (CM) surface (D). Images of MCF7 (second column) and MDA-MB231 (third column) cells revealed MRC NPs, often present within cytoplasm (B, C). MRC NPs within vesicles in MCF-7 cells (E). Bigger clusters of MRC NPs (white arrows) were found in MDA-MB231 cells (C, F). MRC NPs reached the nucleus (N) in MCF7 and MDA-MB231 cells (H, I) while free NPs in the nucleus were observed in HNTMCs (G). Red arrowhead shows perinuclear vacuoles in MCF7 cells (H). *Karyorrhexis evidenced in MCF7 (H) and MDA-MB231 (I) nuclei.
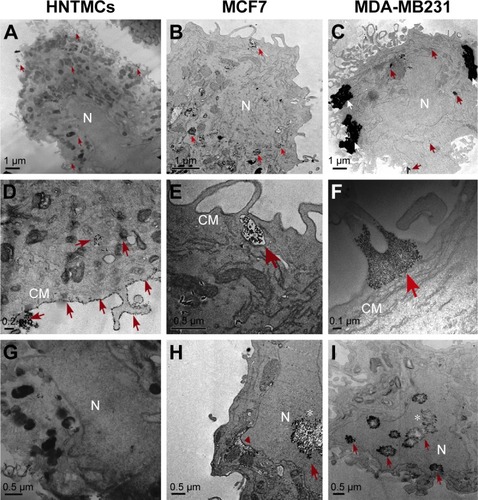
Figure 2 Raman spectra of maghemite–rhodium citrate (MRC) nanoparticles dried on quartz and in MDA-MB231 cells (left).
Notes: The average spectra of different cellular components of MDA-MB231 cells are shown with their characteristic barcodes (right). The assignment of typical vibrational bands is denoted. p and l (*) indicate protein and lipid vibrational modes, respectively.
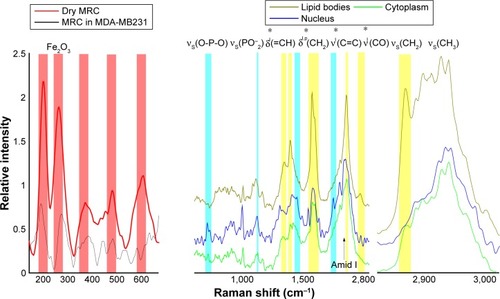
Figure 3 Intracellular maghemite–rhodium citrate nanoparticle (MRC NPs) location by confocal Raman microspectroscopy.
Notes: Images of different components of MCF7 (A) and MDA-MB231 (B) cells exposed to MRC NPs over 24 hours. The color-coded images on the left represent the overlapping of cytoplasm (green), nuclei (blue), lipids (yellow), and MRC NPs (red).
Abbreviation: LDs, lipid droplets.
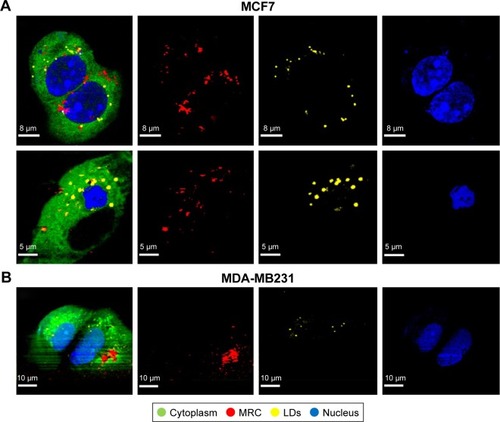
Figure 4 Endocytosis study.
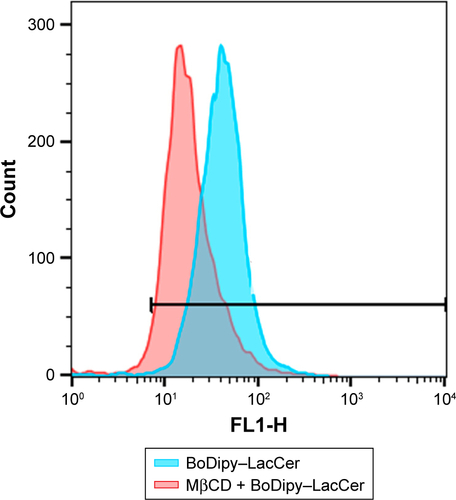
Notes: (A) Western blot showing clathrin and caveolin expression in MDA-MB231, MCF7, and human nontumor mesenchymal cells (HNTMCs), both control (C) and treated (T). Sample loading was adjusted to equalize total protein. (B) Flow-cytometry light-scattering analysis showing MDA-MB231 cells with maghemite–rhodium citrate (MRC) nanoparticles (red) and without MRC nanoparticles (blue). (C) MRC uptake by MDA-MB231 was quantified after clathrin (Pitstop 2) and caveolin (MβCD) inhibition. *P<0.05.
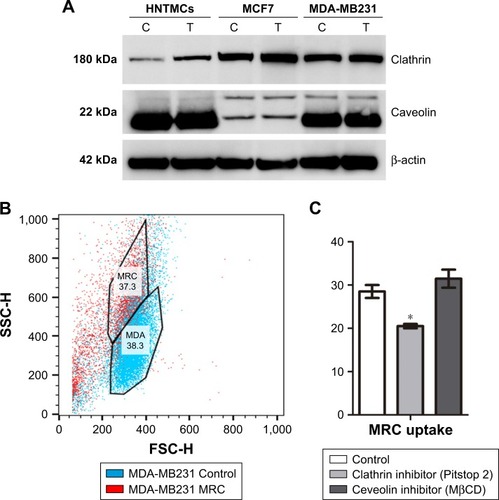
Figure 5 Maghemite–rhodium citrate nanoparticle (MRC NPs)-uptake efficiency in breast tumor cells (MCF7 and MDA-MB231) and human nontumor mesenchymal cells (HNTMCs).
Notes: (A) Cells in a resin section imaged by scanning electron microscopy. (B) Cellular areas demarcated using Point & Shoot acquisition mode (Thermo Fisher Scientific) and completely analyzed by energy-dispersive spectroscopy. (C) Percentage of iron in the analyzed cells. (D) Relative areas (%) containing MRC NPs on transmission electron micrography of MDA-MB231, MCF7, and HNTMCs. *P<0.05; **P<0.01; ***P<0.001. Magnification in A and B ×1,800.
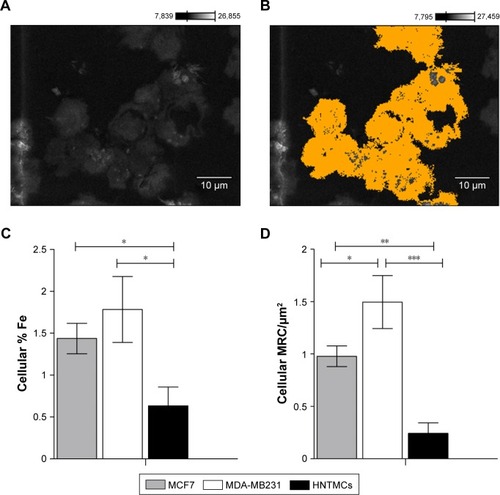
Figure S1 Hydrodynamic diameter analysis in culture media.
Notes: Maghemite–rhodium citrate (MRC) diluted in culture medium had larger hydrodynamic diameter than in water dilution (a*). There was no difference among hydrodynamic diameters of MRC diluted in L15, RPMI, and DMEM culture medium.
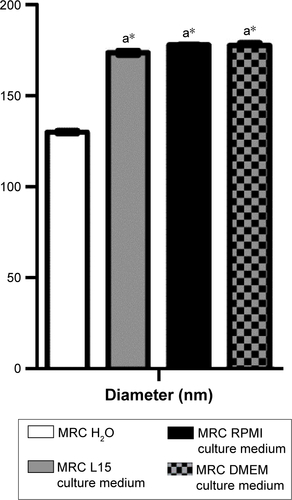
Figure S2 Relative densities of clathrin bands.
Note: Bands in human nontumor mesenchymal cells (HNTMCs), MCF7, and MDA-MB231 cells after 6 hours of exposure of maghemite–rhodium citrate nanoparticles (treatment) in gray bars and control group in black bars (normalized to β-actin, protein loading control).
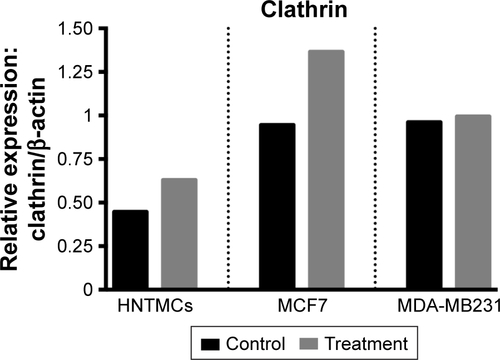
Figure S3 Endosome inhibitor-cytotoxicity analysis. Cell viability analyzed by MTT did not show viability reduction after 2 hours’ exposure.
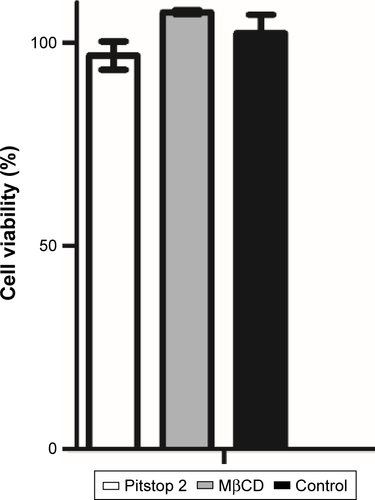
Figure S4 Clathrin inhibition. Alexa 488-labeled transferrin-uptake reduction after Pitstop2 inhibition of clathrin.
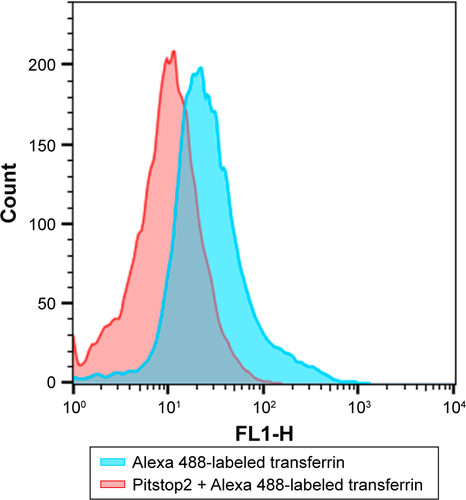
Figure S5 Caveolin inhibition. BoDipy–LacCer-uptake reduction after MβCD inhibition of caveolin.